

좋아하던 일도 재미가 없고, 아침에 몸을 일으키는 것조차 버겁습니다. 별 이유 없이 눈물이 나고, "다 내 탓"이라는 생각이 머리를 떠나지 않습니다. 의지가 약해서가 아니라 몸과 마음이 함께 지쳐 버린 상태, 우울증일 수 있습니다.
우울증 한눈에 보기
- 우울한 기분이나 흥미 상실이 2주 넘게 이어지고 잠·식욕·기력·집중력까지 함께 무너지는, 의지만으로 벗어나기 어려운 질환입니다.
- 전 세계 성인 약 3%가 겪고, 코로나 유행 뒤 27.6% 늘었으며, 불면증이 있으면 우울증 위험이 2배 넘게 높아집니다.
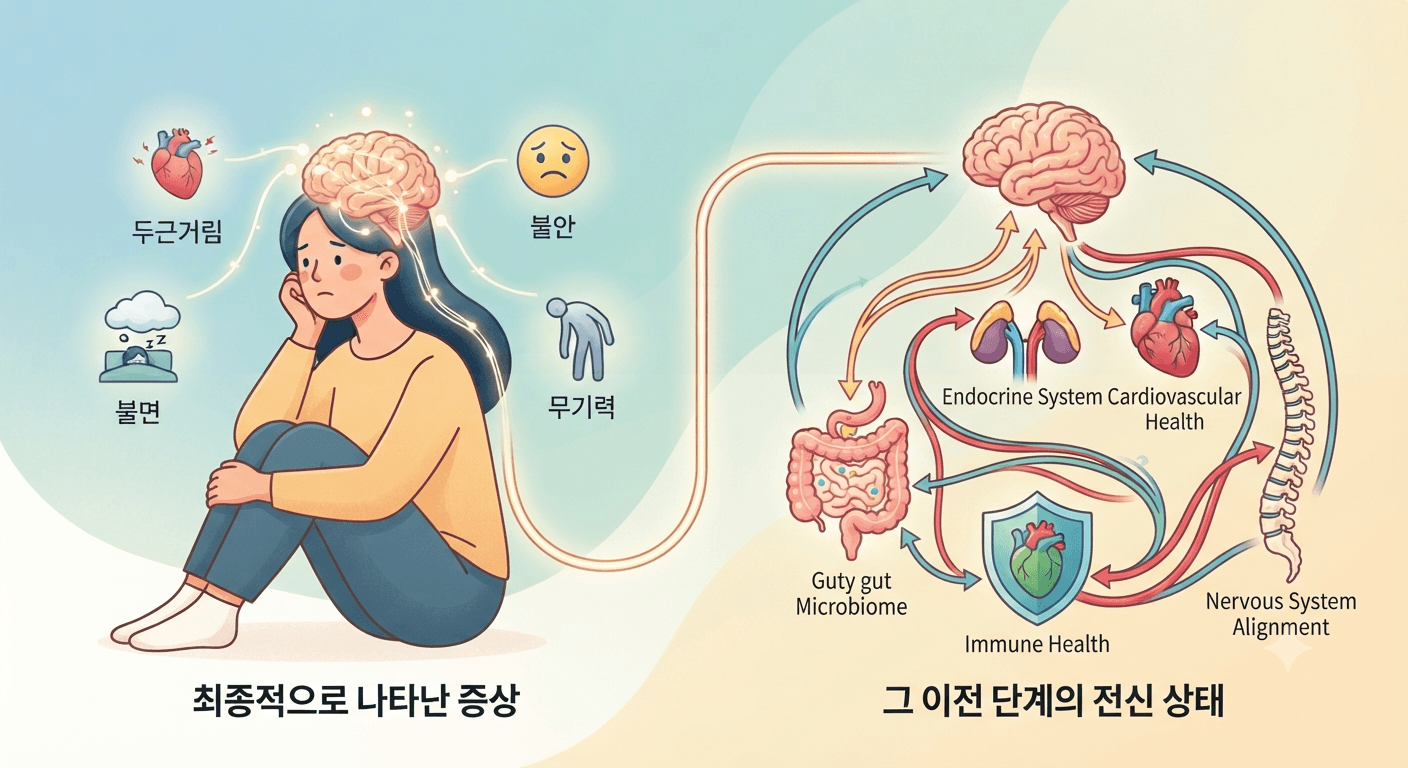
- 마음의 병이면서 몸의 병이기도 해서, 자율신경의 균형과 몸의 염증·수면·소화 상태를 함께 회복해야 다시 일어설 힘이 생깁니다.
- 치료후기 10건
- 의료진 칼럼 2편
- 건강정보 1편
- 온라인 상담 3건
우울증이란?

누구나 슬프고 기운 없는 날이 있습니다. 하지만 우울한 기분이나 아무것도 즐겁지 않은 상태가 하루 대부분, 거의 매일, 2주 넘게 이어지고 잠·식욕·기력·집중력까지 함께 무너진다면 우울증으로 봅니다. 우울증은 의지가 약해서 생기는 것이 아니라, 뇌와 몸이 함께 지쳐 회복하는 힘을 잃은 상태입니다.
우울증은 흔한 병입니다. 2020년 전 세계 주요우울장애는 인구 10만 명당 약 3,153명(약 3%)이었고, 코로나 유행으로 5,320만 건(27.6%)이 늘었으며 여성과 젊은 층이 더 크게 영향을 받았습니다[1].
이런 증상이 있나요?

- 하루 대부분 우울하거나 마음이 텅 빈 것 같다
- 좋아하던 일에도 흥미가 없고 즐겁지 않다
- 늘 피곤하고 기운이 없어 씻거나 나가는 것도 버겁다
- 잠을 못 자거나, 반대로 너무 많이 잔다
- 입맛이 없어 살이 빠지거나, 반대로 폭식하게 된다
- 집중이 안 되고 작은 결정도 내리기 어렵다
- 내가 쓸모없게 느껴지고 자꾸 나를 탓하게 된다
- 가슴이 답답하거나 소화가 안 되고, 몸 여기저기가 아프다
두 주 넘게 이 가운데 다섯 가지 이상이 이어지고, 그중에 우울한 기분이나 흥미 상실이 들어 있다면 우울증을 의심해 봐야 합니다. 우울증은 불안과 함께 오는 경우가 많아, 기분장애와 불안장애는 서로 함께 나타날 가능성이 6배가량 높았습니다[2]. 죽고 싶다는 생각이 든다면 혼자 견디지 말고 바로 도움을 요청하세요(자살예방 상담전화 109).
우울증은 왜 생기나요?
- 오래 이어진 스트레스, 상실이나 큰 변화
- 잠을 잘 이루지 못하는 상태: 불면증이 있으면 이후 우울증 위험이 2.27배 높았습니다[3]
- 출산·갱년기 같은 호르몬 변화, 만성 질환
- 몸을 거의 움직이지 않는 생활
- 가족 중 우울증이 있는 경우
우울증은 몸에도 분명한 흔적을 남깁니다. 우울증 환자는 건강한 사람과 심박변이도가 달라 자율신경의 균형이 깨져 있었고, 치료로 우울 증상이 좋아질 때 심박변이도도 함께 변했습니다[4]. 또 우울증 환자 4명 중 1명(27%)은 혈액 검사에서 몸속 염증 수치(CRP)가 올라가 있었습니다[5]. 우울증이 마음의 병이면서 몸 전체의 병이기도 하다는 뜻입니다.
우울증의 표준 치료
우울증의 표준 치료는 항우울제와 정신치료입니다. 다만 첫 약으로 증상이 거의 사라지는(관해) 사람은 약 37%였고, 약을 바꿔 가며 네 단계까지 치료해야 누적 관해율이 67%에 이르렀습니다[6]. 많은 분이 약을 여러 번 바꾸며 긴 시간을 보내는 이유입니다.
우울증이 뇌만의 문제가 아니라 자율신경과 염증, 수면과 소화까지 몸 전체가 함께 가라앉은 상태라면, 몸의 바탕을 끌어올리는 치료가 함께 필요합니다. 한의학 치료는 막힌 기운을 풀고 바닥난 힘을 채워, 몸이 다시 회복할 수 있는 상태를 만드는 데 초점을 둡니다.
몸을 움직이는 것도 회복에 도움이 됩니다. 권장량(빠르게 걷기 주 2시간 반 정도)만큼 활동하는 사람은 우울증 위험이 25% 낮았습니다[7].
해움한의원은 이렇게 치료합니다

해움한의원 역시 기분만이 아니라 잠, 식욕, 기력, 소화처럼 함께 무너진 몸의 회복을 치료의 중심에 둡니다.
1단계. 몸과 마음이 얼마나 지쳤는지 확인합니다
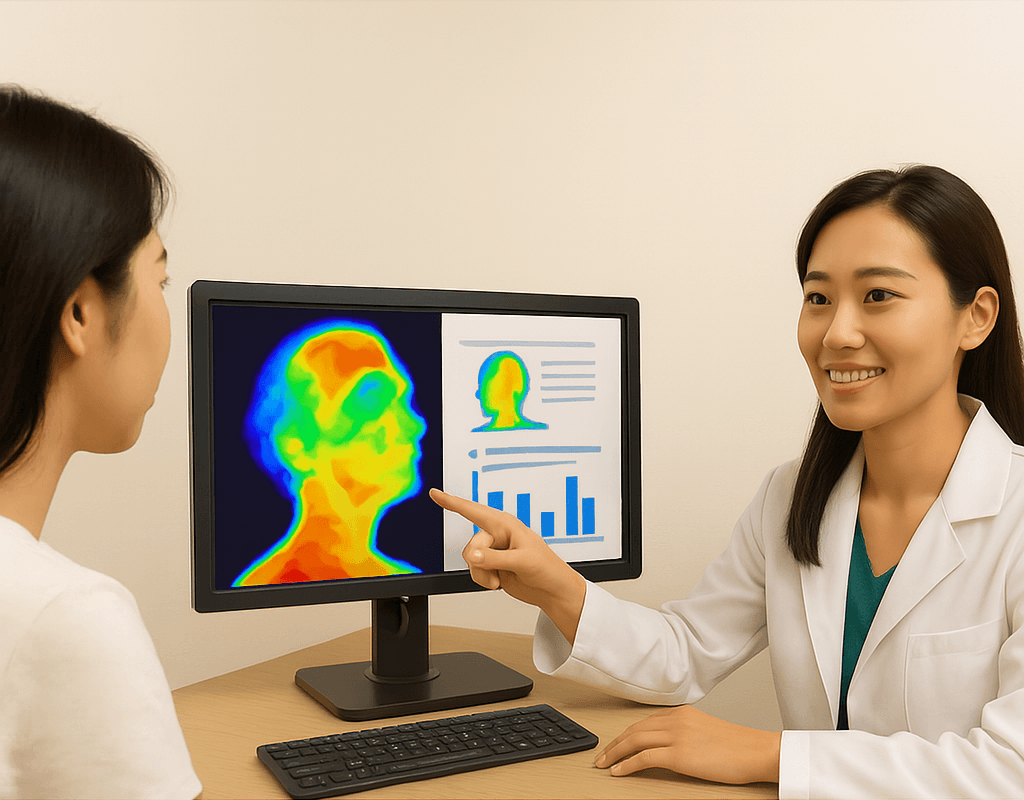
우울이 시작된 계기와 생활, 잠·식욕·소화 상태를 자세히 살펴보고, 심박변이도와 뇌파로 자율신경의 균형과 각성 상태를 확인합니다. 갑상선 기능 이상이나 빈혈처럼 우울과 비슷한 증상을 만드는 몸의 원인이 의심되면 필요한 검사를 안내합니다.
2단계. 막힌 기운을 풀고 바닥난 힘을 채웁니다
체질과 상태에 맞춰 한약을 짓습니다. 약침과 추나로 굳은 몸의 긴장을 풀어 잠과 소화가 먼저 회복되도록 돕습니다.
3단계. 다시 움직일 힘을 함께 만듭니다
심리상담사 1급 자격을 갖춘 원장이 자책과 무력감을 키우는 생각을 함께 살피고, 아침 햇볕 쬐기와 짧은 걷기처럼 할 수 있는 작은 일부터 생활을 되살리도록 안내합니다. 항우울제를 복용 중이라면 처방한 의사와 상의하며 병행할 수 있도록 돕습니다.
4만 건의 처방 사례가 말해주는, 한방 맞춤 치료의 힘

우울증 치료후기 총 10건
환자분들이 남긴 치료후기입니다. 본문은 로그인 후 보실 수 있습니다.

가슴답답 호흡곤란 공황장애 우울증 심장빨리뜀 우측 아랫배 통증 한의원 4개월
2024. 12. 18.
수험생우울증, 항상 우울하고 죽음을 생각했던 여학생, 무사히 대학 갔다고 찾아왔어요
2022. 08. 10.
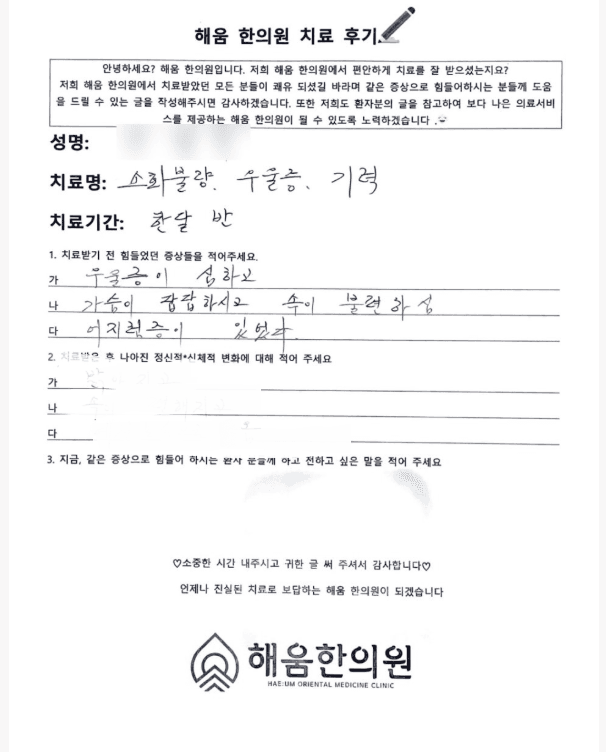
평생을 달고 살아온 소화불량, 노인 우울증 한약 1달반 먹고 좋아진 사례
2022. 08. 02.
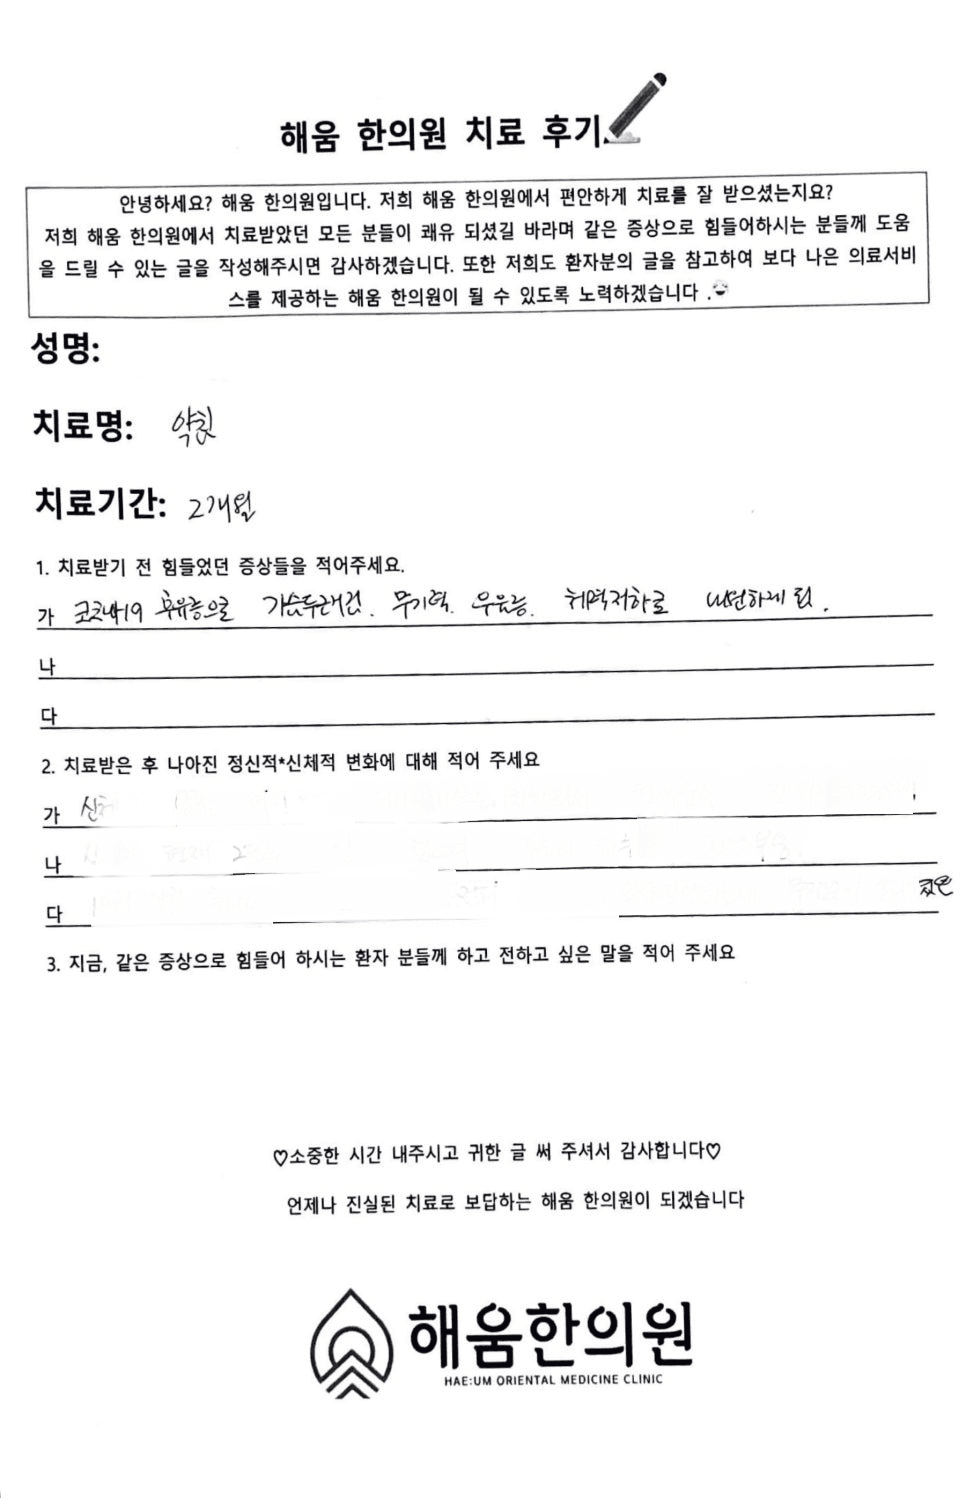
가슴두근거림,무기력,우울증,체력저하 한약 치료기
2022. 06. 27.
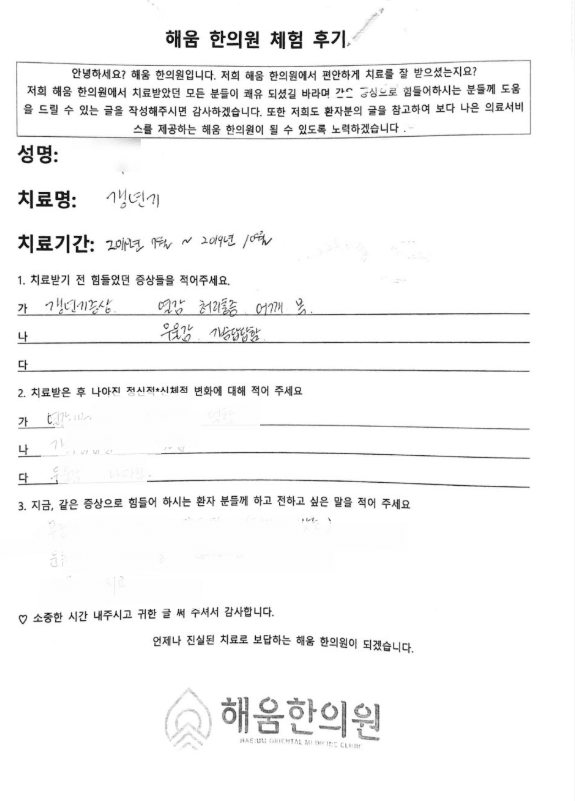
가슴답답하고 우울하고 열이 오르고 전신이 다 아프다 하신 환자분 3개월
2022. 04. 11.
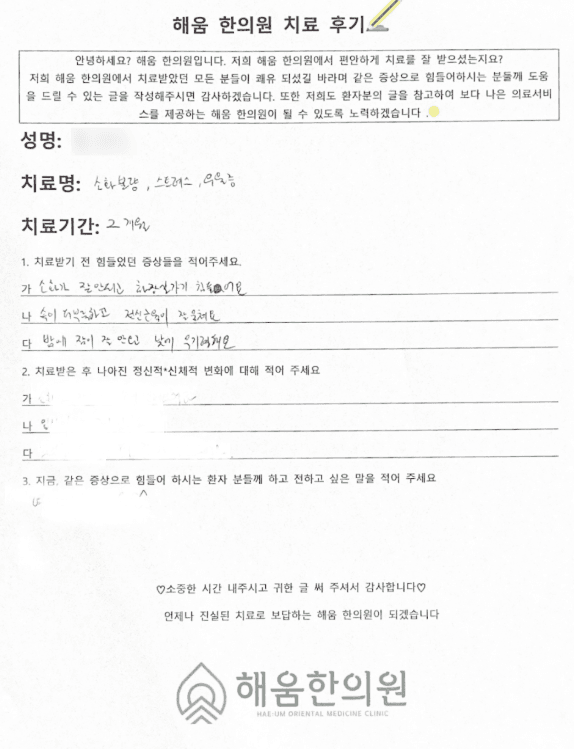
변비로 항상 더부룩했던 환자, 변비 좋아지면서 불면, 우울증도 같이 좋아진 사례
2021. 09. 04.
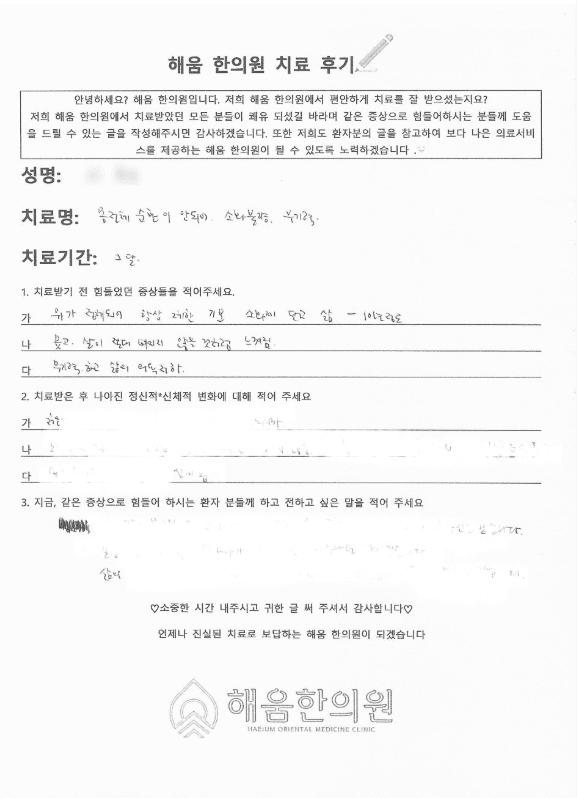
다른 증상으로 내원하신 분들의 후기 중 ‘우울증’이 증상으로 함께 언급된 기록
우울증, 누가 진료하나요?
담당 의료진
대표원장 박재은

“병이 아니라 그 뒤의 사람을 봅니다”
경희대학교 한의과대학에서 석사·박사 과정을 마쳤습니다. 심리상담사 1급 자격과 4만 건 이상의 한약 처방 경험을 바탕으로 진료합니다.
의료진 소개 더보기우울증, 자주 묻는 질문
항우울제를 먹고 있는데 한방치료를 같이 받아도 되나요?
우울증은 의지로 이겨 낼 수 있는 것 아닌가요?
가족이 우울증인 것 같은데 어떻게 도와야 하나요?
치료 기간은 얼마나 걸리나요?
생활에서 도움이 되는 것은 무엇인가요?
한의원 진료 기록이 남으면 불이익이 있나요?
해움한의원에서 우울증을 진료하나요?
우울증으로 내원하려면 어떻게 하나요?
우울증이 심할 때는 어떻게 해야 하나요?
우울증에 관해 알아두면 좋은 정보
1건우울증과 관련해 정리한 건강정보입니다.

우울증, 질문 있어요
3건환자분들이 남긴 온라인 상담 질문과 의료진 답변입니다.
이런 경우에는 바로 도움을 받으세요
아래 상황은 혼자 견딜 일이 아닙니다. 해당한다면 지체하지 말고 응급실이나 정신건강의학과 진료를 먼저 받으세요.
- 죽고 싶다는 생각이 자주 들거나, 방법을 구체적으로 떠올리게 된다: 자살예방 상담전화 109(24시간), 119 또는 가까운 응급실
- 며칠째 거의 먹지도 자지도 못하고 있다
- 다른 사람에게 들리지 않는 소리가 들리거나, 사실이 아닌 생각을 강하게 믿게 된다
- 출산 후 우울이 2주 넘게 이어지거나, 아기를 해칠 것 같은 생각이 든다
참고문헌 7편
[1]COVID-19 Mental Disorders Collaborators. Global prevalence and burden of depressive and anxiety disorders in 204 countries and territories in 2020 due to the COVID-19 pandemic. Lancet. 2021;398(10312):1700-1712. doi:10.1016/s0140-6736(21)02143-7. PMID: 34634250.
초록 (Abstract)
Background: Before 2020, mental disorders were leading causes of the global health-related burden, with depressive and anxiety disorders being leading contributors to this burden. The emergence of the COVID-19 pandemic has created an environment where many determinants of poor mental health are exacerbated. The need for up-to-date information on the mental health impacts of COVID-19 in a way that informs health system responses is imperative. In this study, we aimed to quantify the impact of the COVID-19 pandemic on the prevalence and burden of major depressive disorder and anxiety disorders globally in 2020.
Methods: We conducted a systematic review of data reporting the prevalence of major depressive disorder and anxiety disorders during the COVID-19 pandemic and published between Jan 1, 2020, and Jan 29, 2021. We searched PubMed, Google Scholar, preprint servers, grey literature sources, and consulted experts. Eligible studies reported prevalence of depressive or anxiety disorders that were representative of the general population during the COVID-19 pandemic and had a pre-pandemic baseline. We used the assembled data in a meta-regression to estimate change in the prevalence of major depressive disorder and anxiety disorders between pre-pandemic and mid-pandemic (using periods as defined by each study) via COVID-19 impact indicators (human mobility, daily SARS-CoV-2 infection rate, and daily excess mortality rate). We then used this model to estimate the change from pre-pandemic prevalence (estimated using Disease Modelling Meta-Regression version 2.1 [known as DisMod-MR 2.1]) by age, sex, and location. We used final prevalence estimates and disability weights to estimate years lived with disability and disability-adjusted life-years (DALYs) for major depressive disorder and anxiety disorders.
Findings: We identified 5683 unique data sources, of which 48 met inclusion criteria (46 studies met criteria for major depressive disorder and 27 for anxiety disorders). Two COVID-19 impact indicators, specifically daily SARS-CoV-2 infection rates and reductions in human mobility, were associated with increased prevalence of major depressive disorder (regression coefficient [B] 0·9 [95% uncertainty interval 0·1 to 1·8; p=0·029] for human mobility, 18·1 [7·9 to 28·3; p=0·0005] for daily SARS-CoV-2 infection) and anxiety disorders (0·9 [0·1 to 1·7; p=0·022] and 13·8 [10·7 to 17·0; p<0·0001]. Females were affected more by the pandemic than males (B 0·1 [0·1 to 0·2; p=0·0001] for major depressive disorder, 0·1 [0·1 to 0·2; p=0·0001] for anxiety disorders) and younger age groups were more affected than older age groups (−0·007 [–0·009 to −0·006; p=0·0001] for major depressive disorder, −0·003 [–0·005 to −0·002; p=0·0001] for anxiety disorders). We estimated that the locations hit hardest by the pandemic in 2020, as measured with decreased human mobility and daily SARS-CoV-2 infection rate, had the greatest increases in prevalence of major depressive disorder and anxiety disorders. We estimated an additional 53·2 million (44·8 to 62·9) cases of major depressive disorder globally (an increase of 27·6% [25·1 to 30·3]) due to the COVID-19 pandemic, such that the total prevalence was 3152·9 cases (2722·5 to 3654·5) per 100 000 population. We also estimated an additional 76·2 million (64·3 to 90·6) cases of anxiety disorders globally (an increase of 25·6% [23·2 to 28·0]), such that the total prevalence was 4802·4 cases (4108·2 to 5588·6) per 100 000 population. Altogether, major depressive disorder caused 49·4 million (33·6 to 68·7) DALYs and anxiety disorders caused 44·5 million (30·2 to 62·5) DALYs globally in 2020.
Interpretation: This pandemic has created an increased urgency to strengthen mental health systems in most countries. Mitigation strategies could incorporate ways to promote mental wellbeing and target determinants of poor mental health and interventions to treat those with a mental disorder. Taking no action to address the burden of major depressive disorder and anxiety disorders should not be an option.
Funding: Queensland Health, National Health and Medical Research Council, and the Bill and Melinda Gates Foundation.
결과 (Results)
Of the 5683 unique data sources obtained from the systematic review, 1674 remained following title and abstract screening. In total, 46 studies met inclusion criteria for major depressive disorder and 27 for anxiety disorders (48 in total, one of which reported data across two regions; appendix p 19). A supplemental search for pre-pandemic baseline measures provided an additional 11 studies for major depressive disorder and seven studies for anxiety disorders. Study characteristics of included studies are in the appendix (pp 33–34). Most studies were from western Europe (n=22) and high-income North America (n=14), and the remaining studies were from Australasia (n=5), high-income Asia Pacific (n=5), east Asia (n=2), and central Europe (n=1; appendix p 20).
Human mobility and daily SARS-CoV-2 infection rate were significantly associated with the change in major depressive disorder and anxiety disorder prevalence (table 1). After controlling for human mobility and daily SARS-CoV-2 infection rate, daily excess mortality rate was not associated with the change in prevalence for either major depressive disorder or anxiety disorders. This was likely due to high collinearity between the daily excess mortality rate and the other two COVID-19 impact variables (r = 0·8 with daily SARS-CoV-2 infection rate and r = 0·8 with human mobility), which was less of an issue shared between the daily SARS-CoV-2 infection rate and human mobility (r = 0·5).Table 1Meta-regression coefficients from the indicator model on the change in major depressive disorder and anxiety disorders logit prevalences over the course of the COVID-19 pandemic in 2020Major depressive disorderAnxiety disordersB (95% UI)p valueB (95% UI)p valueDecreasing human mobility0·9 (0·1 to 1·8)0·0290·9 (0·1 to 1·7)0·022Daily SARS-CoV-2 infection rate*18·1 (7·9 to 28·3)0·000513·8 (10·7 to 17·0)<0·0001Daily excess mortality rate*†0·0 (−122·6 to 122·6)>0·99990·0 (−112·5 to 112·5)>0·9999All indicators included in the model simultaneously and therefore control for each other. UI=uncertainty interval.*Square-root transformed before analysis to correct for positive skew (appendix pp 6–7).†Bayesian directional prior specified due to strong collinearity with other indicators.
Increases in the COVID-19 impact index (informed by the significant indicators of human mobility and daily SARS-CoV-2 infection rate) were associated with an increase in prevalence of major depressive disorder (0·4 [95% UI 0·1–0·6]) and anxiety disorders (0·4 [0·3–0·5]; table 2). For both disorders, females were affected more than males, and younger age groups were affected more than older age groups. Bias covariates for cross-sectional comparisons informed by random samples and longitudinal comparisons informed by market research and quota samples were not significant for either disorder (appendix p 67) and subsequently were dropped from the final models (table 2). Estimates representing combined depressive and anxiety disorder symptoms significantly overestimated the increase in prevalence for anxiety disorders 0·3 (0·1–0·4) but not for major depressive disorder (appendix p 67) and were not included in the major depressive disorder model. Cross-sectional market research and quota samples significantly overestimated the increase in prevalence for both major depressive disorder (0·9 [0·6–1·2]) and anxiety disorders (0·6 [0·2–1·0]; table 2). Results of our leave-one-country-out cross-validation analysis are in the appendix (p 11).Table 2Meta-regression coefficients on the change in major depressive disorder and anxiety disorders logit prevalences over the course of the COVID-19 pandemic in 2020Major depressive disorderAnxiety disordersB (95% UI)p valueB (95% UI)p valueCOVID-19 impact index0·4 (0·1 to 0·6)0·00440·4 (0·3 to 0·5)<0·0001Decreasing human mobility*0·3 (0·03 to 0·8)..0·4 (0·1 to 0·8)..Daily SARS-CoV-2 infection rate*†6·6 (1·6 to 13·0)..6·0 (4·3 to 8·1)..Mean or midpoint age−0·007 (−0·0009 to −0·0006)0·0001−0·003 (−0·005 to −0·0002)0·0001Proportion female0·1 (0·1 to 0·2)0·00010·1 (0·1 to 0·2)0·0001Combined depressive and anxiety disorder symptoms....0·3 (0·1 to 0·4)0·0080Cross-sectional market research and quota sample0·9 (0·6 to 1·2)<0·00010·6 (0·2 to 1·0)0·0022Longitudinal market research and quota sample was not significant, and so not included in the final model.*Coefficients are estimated using the B of the COVID-19 impact index multiplied by the B of the COVID-19 impact indicators from the signal model and 95% UIs estimated via multiplying 1000 samples of the posterior distribution of these impact indicator covariates from the indicator model with 1000 samples of the posterior distribution of the indicator coefficient.†Square-root transformed before analysis to correct for positive skew of the COVID-19 impact index coefficient (appendix pp 6–7). UI=uncertainty interval.
Before adjustment for the COVID-19 pandemic, the estimated global prevalence of major depressive disorder in 2020 was 2470·5 cases (95% UI 2143·5–2870·7) per 100 000 population, equivalent to 193 million (167–224) people (appendix pp 35–50). After adjustment for the COVID-19 pandemic, the estimated prevalence of major depressive disorder was 3152·9 cases (2722·5–3654·5) per 100 000 population, equivalent to 246 million (212–285) people. We estimated an additional 53·2 million (44·8–62·9) cases of major depressive disorder globally in 2020 due to the effects of COVID-19 (682·4 [574·1–807·2] new cases per 100 000 population, an increase of 27·6% [25·1–30·3]; table 3). Females had a greater increase in prevalence of major depressive disorder than males did, with 35·5 million (30·0–41·8) additional cases among females (equivalent to 912·5 [772·1–1075·2] per 100 000 females; a 29·8% [27·3–32·5] increase) compared with 17·7 million (14·7–21·3) additional cases in males (equivalent to 453·6 [376·3–545·0] per 100 000 males; a 24·0% [21·5–26·7] increase; data by sex by super-region and region are available on the Global Health Data Exchange). Global patterns of prevalence before and after adjustment for (ie, during) the COVID-19 pandemic, by age and sex, are presented in figure 1, and estimates of the change in prevalence of major depressive disorder are shown in figure 2 and in the appendix (p 21).Table 3Prevalence of major depressive disorder and anxiety disorders, by super-region, 2020Major depressive disorder, per 100 000 populationAnxiety disorders, per 100 000 populationBaseline (95% UI)Additional (95% UI)Final (95% UI)Percentage change (95% UI)Baseline (95% UI)Additional (95% UI)Final (95% UI)Percentage change (95% UI)Global2470·5 (2143·5–2870·7)682·4 (574·1–807·2)3152·9 (2722·5–3654·5)27·6 (25·1–30·3)3824·9 (3283·3–4468·1)977·5 (824·8–1161·6)4802·4 (4108·2–5588·6)25·6 (23·2–28·0)Central Europe, eastern Europe, and central Asia2519·7 (2185·0–2911·5)741·6 (579·1–941·3)3261·3 (2798·6–3804·8)29·4 (23·9–35·8)3274·3 (2801·2–3821·9)981·0 (774·1–1214·4)4255·3 (3593·1–4970·8)30·0 (24·9–35·0)High-income3103·3 (2735·6–3526·4)840·1 (671·7–1030·4)3943·3 (3466·9–4516·1)27·1 (22·6–31·5)5356·8 (4609·1–6233·3)1349·0 (1044·1–1678·8)6705·7 (5773·4–7829·4)25·2 (20·3–30·7)Latin America and Caribbean2626·8 (2291·4–3034·4)914·2 (737·4–1127·5)3541·0 (3063·3–4097·7)34·8 (29·5–40·7)5705·9 (4865·4–6732·9)1804·1 (1425·8–2225·1)7510·0 (6397·9–8786·6)31·7 (25·8–37·7)North Africa and Middle East3321·4 (2752·3–4013·2)1235·2 (896·1–1642·5)4556·6 (3729·1–5578·3)37·2 (29·5–46·0)5148·9 (4210·4–6289·4)1664·8 (1178·0–2251·6)6813·6 (5557·9–8391·8)32·4 (24·9–41·1)South Asia2664·2 (2313·9–3099·5)962·6 (761·6–1187·1)3626·8 (3122·5–4232·7)36·1 (29·7–42·8)3019·7 (2590·4–3531·6)1058·3 (813·0–1318·7)4077·9 (3459·3–4786·7)35·1 (28·2–42·0)Southeast Asia, east Asia, and Oceania1707·8 (1492·4–1958·7)195·8 (121·8–281·4)1903·6 (1656·1–2194·3)11·5 (7·2–16·0)3367·2 (2903·3–3891·5)466·0 (307·2–632·0)3833·2 (3281·8–4478·2)13·8 (9·3–18·3)Sub-Saharan Africa2429·0 (2048·0–2910·2)559·0 (423·3–722·8)2988·0 (2513·5–3583·4)23·0 (18·3–27·9)3001·9 (2465·1–3671·3)644·0 (479·0–829·9)3645·9 (2985·7–4475·5)21·5 (17·1–25·7)UI=uncertainty interval.Figure 1Global prevalence of major depressive disorder (A) and anxiety disorders (B) before and after adjustment for (ie, during) the COVID-19 pandemic, 2020, by age and sexFigure 2Change in the prevalence of major depressive disorder after adjustment for (ie, during) the COVID−19 pandemic, 2020
Before adjustment for the COVID-19 pandemic, the estimated global prevalence of anxiety disorders in 2020 was 3824·9 (95% UI 3283·3–4468·1) per 100 000 population, which is equivalent to 298 million (256–348) people (appendix pp 51–66). After adjustment for the COVID-19 pandemic, the global prevalence of anxiety disorders in 2020 was 4802·4 (4108·2–5588·6), equivalent to 374 million (320–436) people. We estimated an additional 76·2 million (64·3–90·6) cases of anxiety disorders in 2020 due to the COVID-19 pandemic (977·5 [824·8–1161·6] new cases per 100 000 population; an increase of 25·6% (23·2–28·0) globally (table 3). Females had a greater increase in prevalence than males did, with 51·8 million (43·8–61·1) additional cases among females (equivalent to 1332·1 [1126·1–1573·2] per 100 000 females; a 27·9% [25·6–30·4] increase) compared with 24·4 million (20·3–29·5) additional cases among males (equivalent to 625·0 [518·3–755·3] per 100 000 males; a 21·7% [19·3–24·1] increase; data by sex by super-region and region will be available on the Global Health Data Exchange after full release of GBD 2020). Global patterns of prevalence before and after adjustment for (ie, during) the COVID-19 pandemic, by age and sex, are presented in figure 1, and estimates of the change in prevalence of anxiety disorders are shown in figure 3 and in the appendix (p 22).Figure 3Change in the prevalence of anxiety disorders after adjustment for (ie, during) the COVID−19 pandemic, 2020
Before adjustment for the COVID-19 pandemic, major depressive disorder was responsible for 38·7 million (95% UI 26·4–53·9) DALYs globally, equivalent to 497·0 DALYs (338·3–691·1) per 100 000 population. After adjustment for the COVID-19 pandemic, major depressive disorder was responsible for 49·4 million (33·6–68·7) DALYs, equivalent to 634·1 DALYs (431·3–881·0) per 100 000 population (appendix pp 35–50). We estimated that the COVID-19 pandemic led to an additional 10·7 million (7·21–14·9) DALYs for major depressive disorder globally, of which 7·07 million (4·80–9·80) were among females and 3·62 million (2·40–5·09) were among males. The global major depressive disorder additional DALY rate due to the COVID-19 pandemic was 137·1 DALYs (92·5–190·6) per 100 000 population, 182·0 (123·5–252·2) per 100 000 females, and 92·5 (61·5–130·3) per 100 000 males (DALY rates by sex by region will be available on the Global Health Data Exchange after full release of GBD 2020). The burden of DALYS due to major depressive disorder by age and sex is presented in figure 4.Figure 4Global burden of major depressive disorder and anxiety disorders by age and sex, 2020Baseline refers to pre-pandemic DALYs and additional refers to additional burden due to the COVID−19 pandemic. DALYs=disability-adjusted life-years.
Before adjustment for the COVID-19 pandemic, anxiety disorders were responsible for 35·5 million (95% UI 23·9–50·1) DALYs globally, equivalent to 454·8 DALYs (307·0–642·5) per 100 000 population (appendix pp 51–66). After adjustment for the COVID-19 pandemic, anxiety disorders were responsible for 44·5 million (30·2–62·5) DALYs globally, equivalent to 570·9 (387·3–802·2) per 100 000 population. Anxiety disorders were responsible for an additional 9·05 million (6·18–12·8) DALYs due to the pandemic, of which 6·11 million (4·21–8·56) DALYs were among females and 2·94 million (1·97–4·19) among males. The global anxiety disorder additional DALY rate due to the COVID-19 pandemic was 116·1 (79·3–163·8) per 100 000 population, 157·2 (108·3–220·3) per 100 000 females, and 75·3 (50·3–107·1) per 100 000 males. The burden of DALYS due to anxiety disorders by age and sex is presented in figure 4.
원문 발췌 · COVID-19 Mental Disorders Collaborators, Lancet 2021 · CC BY 4.0 라이선스에 따라 수정 없이 인용했습니다(본문 속 인용 번호는 생략).
[2]Saha S, Lim CCW, Cannon DL, Burton L, Bremner M, Cosgrove P, et al. Co-morbidity between mood and anxiety disorders: A systematic review and meta-analysis. Depress Anxiety. 2021;38(3):286-306. doi:10.1002/da.23113. PMID: 33225514.
초록 (Abstract)
There is consistent evidence that mood disorders often co‐occur with anxiety disorders, however, the strength of the association of these two broad groups of disorders has been challenging to summarize across different studies. The aim was to conduct a meta‐analysis of publications reporting on the pairwise comorbidity between mood and anxiety disorders after sorting into comparable study types. We searched MEDLINE, Embase, CINAHL, Web of Science, and the grey literature for publications between 1980 and 2017 regardless of geographical locations and languages. We meta‐analyzed estimates from original articles after sorting by: (a) broad or narrow diagnostic criteria, (b) study time‐frame, and (c) estimates with or without covariate adjustments. Over 43 000 unique studies were identified through electronic searches, of which 391 were selected for full‐text review. Finally, 171 studies were eligible for inclusion, including 53 articles from additional snowball searching. In general, regardless of variations in diagnosis type, study time‐frame, temporal order, or use of adjustments, there was substantial comorbidity between mood and anxiety disorders. Based on the entire 90 separate meta‐analyses, the median OR was 6.1 (range 1.5–18.7). Of these estimates, all 90 were above 1, and 87 were significantly greater than 1 (i.e., the 95% confidence intervals did not include 1). Fourteen of the 90 pooled estimates had ORs that were greater than 10. This systematic review found robust and consistent evidence of comorbidity between broadly defined mood and anxiety disorders. Clinicians should be vigilant for the prompt identification and treatment of this common type of comorbidity.
결과 (Results)
The results of the detailed search strategy are shown in Supporting Information eMethods 1‐2 and Figure 1. We identified 43 419 studies from four electronic databases, of which 390 were screened for full‐text reviews including nine LOTE papers. More than half (n = 272) were excluded for various reasons (Figure 1). We also found 53 papers from citation search of “included” papers and grey literature. Consequently, 171 studies were included in our quantitative synthesis drawn from 37 countries (efigure 1). Using 56 pairs of mood and anxiety disorders, 90 estimates were investigated in the meta‐analysis including 76 unidirectional lifetime and period prevalence risk estimates and 14 temporally ordered bidirectional estimates.
Study characteristics of the 171 studies are presented in Table 1 and etable 1. Table 1 includes 147 studies (eReference 1) that presented lifetime and period prevalence estimates whereas eTable 1 includes 36 studies (eReference 2) that presented temporally ordered estimates.
Pairwise association between mood and anxiety disorders: Estimates from the pairwise associations of mood and anxiety disorders are presented in Tables 2, 3, 4, 5. Forest plots and associated funnel plots are presented in efigures 2–90 (includes 14 funnel plots). Of these, we presented three forest plots in the main text (Figures 2, 3, 4). Overall, there was substantial comorbidity between various mood and anxiety disorders with a median OR of 6.1 (range 1.5–18.7). For example, those with MOOD had 19 times elevated risk of GAD (Figure 2); while those with DEP had 13.8 times elevated risk of GAD after pooling all the unadjusted estimates (Figure 3), and 11.7 times elevated risk of GAD after pooling all the adjusted estimates (Figure 4).
MOOD and anxiety disorder: Lifetime comorbidity: We identified nine studies (eReference 3) for lifetime comorbidity between MOOD and different anxiety disorders (Table 2). The pooled OR (95% CI) ranged between 2.4 (1.1, 5.2) for MOOD and specific phobia based on three studies, and 7.7 (3.3, 17.7) for MOOD and ANX based on five studies.
MOOD and anxiety disorder: Period prevalence comorbidity: We identified 20 studies (eReference 4) for period prevalence comorbidity between MOOD and anxiety disorders (Table 2). The crude OR (95% CI) ranged between 9.1 (3.9, 21.3) for MOOD and ANX based on 10 studies, and 18.4 (13.3, 27.2) for MOOD and social phobia based on three studies. The aOR (95% CI) ranged between 5.2 (2.9, 10.0) for MOOD and social phobia based on three studies, and 18.7 (16.2, 21.6) for MOOD and GAD based on five studies.
DEP and anxiety disorder: Lifetime comorbidity: We identified 48 studies (eReference 5) for lifetime comorbidity between DEP and anxiety disorders (Table 3). The crude OR (95% CI) ranged between 3.3 (2.7, 4.0) for DEP and specific phobia based on 14 studies, and 9.0 (5.6, 14.5) for DEP and GAD based on 11 studies. The aOR (95% CI) ranged between 2.4 (1.6, 3.5) for DEP and specific phobia based on seven studies, and 7.4 (4.4, 12.4) for DEP and panic disorder based on 11 studies.
DEP and anxiety disorder: Period prevalence comorbidity: We identified 68 studies (eReference 6) for period prevalence comorbidity between DEP and anxiety disorders (Table 3). The crude OR (95% CI) ranged between 3.7 (2.7, 5.0) for DEP and specific phobia based on eight studies, and 13.8 (9.9, 19.3) for DEP and GAD based on 22 studies. The aOR (95% CI) ranged between 2.9 (2.3, 3.7) for DEP and specific phobia based on three studies, and 11.7 (5.2, 26.3) for DEP and GAD based on 12 studies.
DYS and anxiety disorder: Lifetime comorbidity: We identified 16 studies (eReference 7) for lifetime comorbidity between DYS and anxiety disorders (Table 4). The crude OR (95% CI) ranged between 6.6 (3.8, 11.3) for DYS and OCD based on four studies, and 13.8 (12.3, 15.4) for DYS and GAD based on five studies. The only aOR (95% CI) was between DYS and social phobia: 4.1 (2.1, 8.2) based on five studies.
DYS and anxiety disorder: Period prevalence comorbidity: We identified 17 studies (eReference 8) for period prevalence comorbidity between any DYS and anxiety disorders (Table 4). The crude OR (95% CI) ranged between 6.9 (1.6, 29.3) for DYS and specific phobia based on four studies, and 17.2 (10.4, 28.4) for DYS and PTSD based on three studies. The aOR (95% CI) ranged between 2.3 (0.7, 7.8) for DYS and PTSD based on three studies, and 12.3 (9.8, 15.5) for DYS and GAD based on five studies.
BIPOLAR and anxiety disorder: Lifetime comorbidity: We identified 28 studies (eReference 9) for lifetime comorbidity between BIPOLAR and anxiety disorders (Table 5). The crude OR (95% CI) ranged between 4.4 (2.2, 9.0) for BIPOLAR and social phobia based on six studies, and 7.8 (6.5, 9.4) for BIPOLAR and ANX based on eight studies. The aOR (95% CI) ranged between 3.5 (1.9, 6.6) for BIPOLAR and specific phobia based on four studies, and 8.9 (5.2, 15.3) for BIPOLAR and GAD based on four studies.
BIPOLAR and anxiety disorder: Period prevalence comorbidity: We identified 14 studies (eReference 10) for period prevalence comorbidity between BIPOLAR and different anxiety disorders (Table 5). The crude OR (95% CI) ranged between 4.9 (for BIPOLAR and both ANX (2.0, 12.2) and also specific phobia (4.1, 5.8) based on three studies), and 11.6 (8.9, 15.0) for BIPOLAR and panic disorder based on three studies. The aOR (95% CI) ranged between 3.7 (2.1, 6.5) for BIPOLAR and social phobia based on four studies, and 7.4 (1.6, 34.0) for BIPOLAR and GAD based on three studies.
Temporally ordered associations between mood‐ and anxiety‐related disorders: Although the majority of these estimates could not be pooled because of low number of studies, there was an elevated risk of comorbidity between different MOOD (as a prior disorder) and different anxiety disorders (as a later disorder), and vice‐versa (etables 2 and 3). For example, those with DEP had 2‐3 times elevated risk of later ANX (aOR = 2.1: 95% CI 1.5, 2.8), those with ANX as a prior disorder had similar risk of developing DEP (aOR = 2.1: 95% CI 1.8, 2.5) (etable 3). The highest risk was observed between DEP as a prior disorder and social phobia as a later disorder (OR = 7.3: 95% CI 6.2, 8.7), while the corresponding risk was about one‐third for those with social phobia as a prior disorder and DEP as a later disorder (OR = 2.5: 95% CI 2.1, 3.1).
Overall findings, heterogeneity, quality scores and funnel plots: Most of the pooled estimates showed heterogeneity (the Q‐statistic and I 2 are presented with each forest plot). However, it is important to note that this heterogeneity does not detract from the main findings (i.e., there is strong comorbidity between the two disorders). The pooled estimates for all meta‐analyses were above one, and only one of the 76 uni‐directional meta‐analyses and two of the 14 bidirectional meta‐analyses had 95% confidence intervals that included 1 (Table 4: between DYS and PTSD; and etable 3: between OCD and DEP, and specific phobia and DEP respectively). The Eggers z (test) linked to respective funnel plots ranged between 0.04 (p =.97) for DEP and GAD (efigure 16), and 1.82 (p =.07) for DEP and panic disorder (efigure 21), thus not providing evidence of substantial publication bias for the various pooled estimates. The 14 funnel plots (with studies > 10) are presented in efigures. The quality score between studies ranged between 8 and 16 (Table 1) with the majority having quality scores in the upper range of the scale (median = 13, interquartile range: 12–15). As most of the meta‐analyses were based on small numbers of contributing studies, and because of the relative lack of variation in the quality scores, additional investigation of the impact of this score on the findings was not undertaken.
원문 발췌 · Saha S, Lim CCW, Cannon DL, Burton L, Bremner M, Cosgrove P, Huo Y, J McGrath J, Depress Anxiety 2021 · CC BY 4.0 라이선스에 따라 수정 없이 인용했습니다(본문 속 인용 번호는 생략).
[3]Li L, Wu C, Gan Y, Qu X, Lu Z. Insomnia and the risk of depression: a meta-analysis of prospective cohort studies. BMC Psychiatry. 2016;16(1):375. doi:10.1186/s12888-016-1075-3. PMID: 27816065.
초록 (Abstract)
Background: Observational studies suggest that insomnia might be associated with an increased risk of depression with inconsistent results. This study aimed at conducting a meta-analysis of prospective cohort studies to evaluate the association between insomnia and the risk of depression.
Methods: Relevant cohort studies were comprehensively searched from the PubMed, Embase, Web of Science, and China National Knowledge Infrastructure databases (up to October 2014) and from the reference lists of retrieved articles. A random-effects model was used to calculate the pooled risk estimates and 95 % confidence intervals (CIs). The I 2 statistic was used to assess the heterogeneity and potential sources of heterogeneity were assessed with meta-regression. The potential publication bias was explored by using funnel plots, Egger’s test, and Duval and Tweedie trim-and-fill methods.
Results: Thirty-four cohort studies involving 172,077 participants were included in this meta-analysis with an average follow-up period of 60.4 months (ranging from 3.5 to 408). Statistical analysis suggested a positive relationship between insomnia and depression, the pooled RR was 2.27 (95 % CI: 1.89–2.71), and a high heterogeneity was observed (I 2 = 92.6 %, P < 0.001). Visual inspection of the funnel plot revealed some asymmetry. The Egger’s test identified evidence of substantial publication bias (P <0.05), but correction for this bias using trim-and-fill method did not alter the combined risk estimates.
Conclusions: This meta-analysis indicates that insomnia is significantly associated with an increased risk of depression, which has implications for the prevention of depression in non-depressed individuals with insomnia symptoms.
결과 (Results)
Literature search: Figure 1 presents the process of this study selection. The search strategy identified 4,802 articles, in which 4,185 articles from the PubMed, 355 articles from the Embase, 226 from the Web of Science, and 36 from the CNKI were retrieved. Of these, based on abstracts or titles, the majorities were excluded after the first screening because they were reviews, case reports, or not relevant to our analysis. After full-text review of the remaining 89 studies, 55 studies were excluded for the reasons shown in Fig. 1. Of note, all of the 21 studies included in the previous review were eligible according to the criteria in our research except two duplicated studies used the same samples as the other two studies, and articles with longest follow-up and more detailed information were retained. Thus, 34 eligible cohort studies were finally included in this meta-analysis.Fig. 1Flow chart of study selection of insomnia in relation to depression
Characteristics of studies: The included 34 studies were published between 1989 and 2014, and characteristics of them are shown in Table 1. The sample sizes of the cohorts ranged from 147 to 44,270 with a total of 172,077. The length of follow-up duration ranged from 3.5 to 408 months in this study, with an average of 60.4 months. Fourteen studies were conducted in the United States and in Europe respectively, two studies in Australia, and four studies in Asia. Three studies reported results for males only, and three studies reported results for females only, 27 studies reported results for both males and females,and one study reported results for males and females separately. In the present study, 11 studies diagnosed insomnia on the basis of all DSM- IV criteria : sleep difficulties, duration and daytime consequence (sd, dur and day), 10 studies based the diagnosis only on sleep difficulties and duration criteria (sd and dur), and 13 studies took into consideration only the sleep difficulties criterion (sd). Ten studies assessed insomnia repeatedly during the course of the follow-up, and the rest of the studies assessed insomnia at baseline. Interobserver agreement (κ) between two investigators was 0.98. The results of quality assessment are shown in Table 2. The average score for the quality assessment of included cohort studies was 6.6 (of a possible 9 points), which indicated that the quality for all studies was moderate-high in a whole.Table 1Characteristics of included studies in the meta-analysisStudy sourceStudy nameSexInsomnia measurementDSM-IV-TR insomnia criteria satisfiedDepression measurementFollow-up time (months)Number of follow-up assessmentsBaseline age (years)No of participantsCovariatesFord and Kamerow, 1989, USA National Institute of Mental Health Epidemiologic Catchment Area (ECA) studyM/FDiagnostic Interview Schedulesd§, dur† and dayDiagnostic Interview Schedule121Range 18+;mean 45.797,954Age, sex, socioeconomic status, race, and marital statusBrabbins et al., 1993, UK NoneM/FGeriatric Mental Statesd and durGeriatric Mental State361Range 65+; mean 69.76701No covariate adjustmentBreslau et al., 1996, USA NoneM/FNIHM Diagnostic Interview Schedulesd and durNIHM Diagnostic Interview Schedule421Range 21–30; mean 26.14979Sex, hypersomnia, and number of other depressive symptomsChang et al. 1997 USA Johns Hopkins Precursors StudyMHabit Survey QuestionnairesdChecklists medical reports and self-reports4087Range NA; mean 26.3941Age at graduation, class year, parental history of clinical depression, coffee consumption, and measures of temperamentWeissman et al. 1997 USA National Institute of Mental Health Epidemiologic Catchment Area Study (ECA)M/FQuestionnairessd and durDiagnostic Interview Schedule (DIS)121Range 18+; mean 48.237,113Age, sex, and siteFoley et al. 1999 USA NoneM/FInterviewsdCES-D363Range 65+; mean 80.096,899No covariate adjustmentJohnson et al. 2000 USA NoneM/F1 item from the CBCLsd and durCBCL and TRF601Range NA; mean 6717Sex, birth weight, and mother’s history of MDD using generalized estimation equationsMallon et al. 2000 Sweden County of Dalarna registryM/FUppsala Sleep InventorysdHADS1441Range 45–65; mean 551,244Smoking, depression, and insomniaRoberts et al. 2000 USA Alameda Country studyM/F2 Items from the DSM-12Dsd12 Items from the DSM-12D121Range 50+; mean 64.92,370Age, sex, marital status, social isolation, education, financial problems, problems with daily activities, and heave drinkingRoberts et al. 2002 USA NoneM/FQuestionnairessd, dur and dayDiagnostic Interview Schedule for Children121Range 11–17; mean 153,136Age, values of the functioning measures at baseline, sex, parental education, and insomnia levelHein et al. 2003 Germany NoneM/FComposite International Diagnostic InterviewsdComposite International Diagnostic Interview601Range 55+; mean 60664No covariate adjustmentPerlis et al. 2006 USA NoneM/FHAMD (sleep items)sdSCID and HAMD121Range 60+; mean 72147No covariate adjustmentMorphy et al. 2007 UK NoneM/FJenkins Sleep ScalesdHADS121Range 18+; mean 501,589Age, sex, social class, anxiety (except when anxiety is the problem of interest), depression (except when depression is the problem of interest), and pain areas (except when widespread pain is the problem of interest)Buysse et al. 2008 Switzerland The Zurich StudyM/FSPIKE and visual analogue scalessd, dur and daySPIKE2406Range NA; mean 19.5278Concurrent MDE at the time of insomnia diagnosisCho et al. 2008 USA Depression SubstudyM/FPSQIsd, dur and daySCID and BDI243Range 60+; mean 69329Group status, depression symptoms, medical disease, age, sex, marital status, and educationJansson-Fröjmark and Lindblom.2008 Sweden NoneM/FBasic Nordic Sleep Questionnaires and Uppsala Sleep Inventorysd, dur and dayHADS121Range 20–60; mean 41.31,489Age, sexRoane and Taylor. 2008 USA National Longitudinal Study of Adolescent Health (Add Health)M/FIn-home interviewsd and durIn-home interview781Range 12–18; mean 163,582SexKim et al. 2009 Korea Kwangju community studyM/FInterviewsd, dur and dayGeriatric Mental State241Range 65+; mean 72.2792Age, sex, education, housing, past occupation, current employment, living area, life events, social deficit, physical activity, GMS organicity, GMS anxiety, and daily drinking.Szklo-Coxe et al. 2010 USA Wisconsin Sleep Cohort StudyM/FPSG + interview and self-reported symptomssdZung Self-Rating Depression Scale441Range 33–71; mean 53.6555Age, sex, chronic health conditions, alcohol consumption, cigarette smoking, caffeine consumption, use of hypnotic agents, and BMIYokoyama et al. 2010 Japan Nihon University Japanese Longitudinal Study of Aging: (NUJLSOA)M/FQuestionnaire11-item short form of the CES-D361Range 69+; mean 73.13,065Age, sex, educational history, place of residence, sleep duration, excessive daytime sleepiness, discomfort feeling in the legs, subjective sleep sufficiency, psychological stress, self-rated health, and activities of daily livingJaussent et al. 2011 France French Three-City StudyM/FQuestionnaire and clinical interviewsdCES-D482Range 65+; mean ≥ 603,824Age, center, CES-D baseline, sex, education, living alone, coffee consumption, alcohol consumption, smoking, chronic disease, past major depression, disability, prescribed sleep medication intake, and homeopathic and non-prescription treatments for sleepAlmeida et al. 2011 Australia Health In Men Study (HIMS)MQuestionnairesdMedical records (based on ICD-10)721Range 70+; mean ≥ 605,127Age, education group, migrant status, living alone, low social support group, smoking group, BMI, diabetes, hypertension, arthritis, chronic respiratory diseases, coronary artery disease, stroke, and cancerMarques et al. 2011 Portugal NoneFInterviewsd, dur and dayDSM-IV51Range 18–44; mean 29.8382Negative affect, positive affect, and lifetime depressionThomée et al. 2011 Sweden NoneM/FA single item adapted from the Karolinska Sleep Questionnairesd and durTwo items from the Primary Care Evaluation of Mental Disorders (Prime-MD)121Range 20–24; mean < 601,455Relationship status, educational level, and occupationOkajima et al. 2012 Japan NoneM/FPSQIsd, dur and dayCES-D241Range 20+; mean 57.41,577Age, sex, disease currently treated, habitual alcohol ingestion, smoking habit, and living aloneSalo et al. 2012 Finland Finnish Public Sector StudyM/FThe 4-item Jenkins Sleep Problem ScalesdHealth register and medical records421Range 19–70; mean 43.940,791Age, sex, socioeconomic position, night/shift work, health behaviors, baseline physical health, use of pain killers, psychological distress, and anxietySkapinakis et al. 2013 UK UK National Psychiatric Morbidity surveyM/FThe Revised Clinical Interview Schedule (CIS-R)sd and durThe Revised Clinical Interview Schedule (CIS-R)181Range 16–74; mean 44.752,406Age, sex, marital status, educational qualifications,occupational class, employment status, and other psychological symptomsGehrman et al. 2013 USA Millennium Cohort Study (MCS)M/F2 items from PHQ and PCL-C, and questionnairessd and durPHQ-9842Range NA; mean 33.18,902Sleep duration, birth year, sex, race/ethnicity, educational level, and marital statusSuh et al. 2013 Korea Korean Genome and Epidemiology Study (KoGES)M/FQuestionnairesd and durBDI723Range 43–73; mean 52.31,089Age, sex, education level, employment status, marital status, physical health, smoking status, heavy drinking, and time interactions with each covariatePaudel et al. 2013 USA Prospective Osteoporotic Fractures in Men (MrOS) StudyMPSQIsd, dur and dayGeriatric Depression Scale (GDS)40.81Range 67+; mean 75.92,352Age, clinic site, baseline GDS score, health status, education, use of benzodiazepines, alcohol consumption, cognitive function, walks for exercise, impairments in activities of daily living and certain medical conditionsCampbell et al. 2013 UK North Staffordshire Osteoarthritis Project (NorStOP)M/FJenkins Sleep Questionnairesd and durHADS722Range 50+; mean ≥ 602,373Age, sex, marital status, employment status, alcohol intake, smoking status, and BMIJackson et al. 2014 Australia Australian Longitudinal Study on Women’s Health, (ALSWH)FQuestionnaireNone (sleeping difficulties in the last 12 months)Questionnaire1083Range 22–27; mean < 605,702Education level, body weight dissatisfaction, history of abuse, and binge drinking in 2000Sivertsen et al. 2014 Norway Nord-Trøndelag health study HUNT Study (HUNT2 and HUNT3)M/FQuestionnairesd, dur and dayHADS1321Range 19–67; mean 45.3 (HUNT2) Range 20–89; mean 56.1 (HUNT3)44,270Age, sex, education, angina, arthrosis, asthma, ankylosing spondylitis, cancer, diabetes, fibromyalgia, headache, hypertension, myocardial infarction, obesity, osteoporosis, rheumatoid arthritis, stroke and whiplash at baseline.Dørheim et al. 2014 Norway Akershus Birth CohortFBISsd, dur and dayEPDS3.52Range 17.4–47.5; mean 31.52,088No covariate adjustment Abbreviations: NA not available, F female, M male, NIHM National Institute of Mental Health, CES-D Centre for Epidemiologic Studies Depression, CBCL Child Behavior Checklist, EPDS Edinburgh Postnatal Depression Scale, GMS Geriatric Mental State diagnostic schedule, TRF Teacher Report Form, HADS Hospital Anxiety and Depression Scale, DSM-12D 12-item scale for DSM depression, HAMD Hamilton Rating Scale for Depression, SCID Structured Clinical Interview for DSM Disorders, SPIKE Structured Psychopathological Interview and Rating of Social Consequences of Psychic Disturbances for Epidemiology, PSQI Pittsburgh Sleep Quality Index, BDI Beck Depression Inventory, BIS The Bergen Insomnia Scale, PSG polysomnographic assessment, day daytime consequences criterion §sd, sleep difficulties criterion †dur, duration criterion Table 2Quality assessment of studiesa Study sourceSelectionComparabilityExposureTotal scoreRepresentativeness of the exposed cohortSelection of the non- exposed cohortAscertainment of exposureDemonstration that outcome of interest was not present at start of studyComparability of cohorts on the basis of the design or analysisAssessment of outcomeWas follow-up long enough for outcomes to occur (> = 5 years)Adequacy of follow up of cohorts (>80 %)Ford and Kamerow 111111006Brabbins et al. 111101005Breslau et al. 111111017Chang et al. 111121119Weissman et al. 111111006Foley et al. 111101005Johnson et al. 110111117Mallon et al. 110111106Roberts et al. 110101015Roberts et al. 110121006Hein et al. 011101116Perlis et al. 011101004Morphy et al. 111121007Buysse et al. 111111107Cho et al. 111121018Jansson-Fröjmark and Lindblom 111111017Roane and Taylor 111101105Kim et al. 111121007Szklo-Coxe et al. 111111006Yokoyama et al. 111121007Jaussent et al. 111121007Almeida et al. 111121108Marques et al. 010111004Skapinakis et al. 111121007Salo et al. 111121018Suh et al. 111121119Paudel et al. 111121007Campbell et al. 111121119Jackson et al. 111111118Sivertsen et al. 111121119Okajima et al. 111111006Thomée et al. 011111005Gehrman et al. 011121107Dørheim et al. 011001003 aThe study quality was assessed according to the Newcastle Ottawa Quality assessment scale for cohort studies. This scale awards a maximum of 9 points to each study: 4 for selection, 2 for comparability, and 3 for assessment of outcomes (for cohort study). 1 = “Yes”, 0 = “No”, “Unable to determine” or “Not available”
Quantitative synthesis: The results from the random-effects model combining the RRs for depression in relation to insomnia are shown in Fig. 2. Twenty-six studies suggested a significant positive relationship between insomnia and depression, while the other studies did not. The pooled RR of depression was 2.27 (95 % CI: 1.89–2.71) among populations with insomnia, and a high heterogeneity was observed among studies (I 2 = 92.6 %, P < 0.001).Fig. 2Forest plot of the association between insomnia and risk of depression
Subgroup analysis: Subgroup analysis was conducted by mean age at baseline, sex, study location, insomnia definition, type of depression measurement, follow-up duration, sample size, study quality, publication year (before 2010 vs. after 2010), and whether age, socioeconomic status, smoking status, alcohol intake, body mass index (BMI) were controlled or not in models. Insomnia was significantly associated with an increased risk of depression in all subgroups, with the exception of populations from Australia (RR = 1.79, 95 % CI = 0.90–3.54, I 2 = 95.9 %, P < 0.001). However, moderate to high heterogeneities were observed. No interactions between insomnia and stratification variables in relation to depression risk were observed (all P values for interactions > 0.05; Table 3).Table 3Subgroup analysis of relative risks for the association between insomnia and depressionNo of studiesRR (95 % CI) I 2 (%) P value for heterogeneity P value between groupsMean age at baseline, y <60222.50 (1.96, 3.20)94.70<0.0010.31 ≥60121.87 (1.47, 2.37)80.70<0.001Sex Male31.46 (1.13, 1.88)26.700.2560.48 Female31.96 (1.05, 3.66)73.50<0.001 Mixed282.41 (1.97,.95)92.80<0.001Study location USA143.13 (2.03, 4.85)89.80<0.0010.17 Europe141.73 (1.43, 2.09)88.50<0.001 Asia42.27 (1.22, 4.21)90.40<0.001 Australia21.79 (0.90, 3.54)95.90<0.001Source of participants* General population252.34 (1.85, 2.96)94.00<0.0010.75 Non-general population92.05 (1.53, 2.74)78.70<0.001Insomnia definition Sd, dur and day112.90 (1.78, 4.74)92.70<0.0010.37 Sd and dur102.21 (1.50, 3.25)90.30<0.001 Sd131.87 (1.53, 2.29)87.70<0.001Type of depression measure Self-reported scales172.20 (1.70, 2.86)94.10<0.0010.63 Physician diagnosis152.27 (1.67, 3.09)91.80<0.001 Combined23.89 (1.73, 8.74)0.000.438Follow-up duration, y <5222.34 (1.84, 2.97)93.60<0.0010.77 5–1082.37 (1.73, 3.25)82.30<0.001 >1041.88 (1.52, 2.32)54.600.086Sample size <5000262.01 (1.66, 2.44)86.50<0.0010.10 ≥500083.12 (2.11, 4.62)96.40<0.001Study quality Score >782.06 (1.60, 2.63)88.60<0.0010.70 Score ≤ 7262.36 (1.83, 3.03)93.00<0.001Publication year Before 2010192.63 (1.95, 3.55)88.20<0.0010.21 2010–2014151.94 (1.53, 2.45)94.62<0.001Statistical model Unadjusted51.78 (1.29, 2.47)56.000.0780.75 Adjusted292.31 (1.90, 2.81)93.40<0.001Controlling age in models Yes212.64 (2.04, 3.42)92.30<0.0010.09 No131.75 (1.33, 2.31)92.50<0.001Controlling SES in models Yes172.34 (1.81, 3.03)95.60<0.0010.78 No172.15 (1.74, 2.65)71.60<0.001Controlling smoking status in models Yes72.10 (1.45, 3.06)89.80<0.0010.75 No272.32 (1.88, 2.87)93.30<0.001Controlling alcohol intake in models Yes92.47 (1.75, 3.48)90.90<0.0010.69 No252.19 (1.78, 2.69)92.00<0.001Controlling BMI in models Yes52.19 (1.57, 3.06)85.30<0.0010.94 No292.28 (1.87, 2.78)92.30<0.001 Abbreviations: BMI body mass index, dur duration criterion, day daytime consequences criterion, F female, M male, NA not available, SES socioeconomic status, Sd sleep difficulties criterion *Study population truly or somewhat representative of a community or population-based study defined as general population, and study population was sampled from a special population (such as population from a company, register patients, data from the health insurance company or health examination organization or pregnant), which defined as non-general populations
Sensitivity analysis: Sensitivity analyses were used to identify the potential sources of heterogeneity in association between insomnia and the risk of depression. This helped to examine the influence of various exclusions on the combined RR and test the stability of the quantitative synthesis results. In the leave-one-out analysis by omitting one study in turn, the overall combined RR did not change substantially, with a range from 2.07 (95 % CI: 1.77–2.42) to 2.33 (95 % CI: 1.95–2.78), and I 2 varied from 89.6 to 89.9 %. This indicated that none of the individual studies significantly influenced the overall result. It was worth noting that, six studies defined insomnia as DIS and/or DMS or NRS, and the rest of studies defined insomnia as DIS and/or DMS. There is controversy as to whether individuals with NRS complaint share similar pathophysiologic mechanisms with the other nocturnal symptoms, such as DIS and DMS. Restricting the analysis to the 28 studies defined insomnia as DIS and/or DMS yielded a pooled RR of 2.30 (95 % CI, 1.84 to 2.87) after exclusion of 6 studies. Thus, our main results would not change even if these six studies were excluded.
Publication bias: The visual inspection of the funnel plot identified substantial asymmetry (Fig. 3). The Egger’s test identified evidence of substantial publication bias (P < 0.05). A sensitivity analysis using the trim-and-fill method was performed with 16 imputed studies, which produced a symmetrical funnel plot (Fig. 4). Using the trim-and-fill method, the RR was 1.40 (95 % CI, 1.16–1.69; P < 0.001). Correction for potential publication bias thus did not alter the significant association.Fig. 3Funnel plot with pseudo 95 % confidence limits of insomnia and depression. The horizontal line represents the summary effect estimates, and the dotted lines are pseudo 95 % CIs Fig. 4Filled funnel plot of RR from studies that investigated the association between insomnia and the risk of depression. The circles alone are real studies and the circles enclosed in boxes are ‘filled’ studies. The horizontal line represents the summary effect estimates, and the diagonal lines represent pseudo-95 % CI limits
원문 발췌 · Li L, Wu C, Gan Y, Qu X, Lu Z, BMC Psychiatry 2016 · CC BY 4.0 라이선스에 따라 수정 없이 인용했습니다(본문 속 인용 번호는 생략).
[4]Hartmann R, Schmidt FM, Sander C, Hegerl U. Heart Rate Variability as Indicator of Clinical State in Depression. Front Psychiatry. 2018;9:735. doi:10.3389/fpsyt.2018.00735. PMID: 30705641.
초록 (Abstract)
Background: Depression is a severe disease with great burdens for the affected individuals and public health care systems. Autonomic nervous system (ANS) dysfunction indexed by measures of heart rate variability (HRV) has repeatedly been associated with depression. However, HRV parameters are subject to a wide range of multi-factorial influences and underlying mechanisms in depression are still unclear. HRV parameters have been proposed to be promising candidates for diagnostic or predictive bio-markers for depression but necessary longitudinal design studies investigating the relationship between HRV and depression are scarce.
Methods: The sample in this study consisted of 62 depressive individuals without antidepressant medication prior to assessment and 65 healthy controls. Fifteen minute blocks of resting ECGs were recorded 1–2 days before onset of antidepressant treatment and 2 weeks thereafter. The ECGs were pre-processed to extract inter-beat-intervals. Linear and non-linear methods were used to extract HRV parameters. ANOVAS were performed to investigate group differences between depressive patients and healthy controls. Associations between the change in severity of depression and HRV parameters were assessed in a repeated measurements design.
Results: Analyses revealed HRV parameter differences between the groups of depressive patients and healthy controls at baseline. Further results show differences in HRV parameters within subjects after 2 weeks of antidepressant treatment. Change in HRV parameter values correlated with changes in symptom severity of depression.
Discussion: The current results provide further insight into the relationship between HRV parameters and depression. This may help to underpin utilization of HRV parameters are bio-maker for disease state in depression. Results are discussed within a theoretical framework to link arousal and ANS regulation in depression.
결과 (Results)
General: Total sample mean age was 36.99 (SD = 12.108) ranging from 19 to 61 years. The total sample comprised of 62 males and 65 females. We found no violation of normal distribution for age within groups. Furthermore, we found no significant differences between groups for age [t(125) = −0.066, p = 0.948] and sex (X2 = 0.378, df = 1, p = 0.538). We collapsed data across sex and age for subsequent analyses. There were no differences between groups for heart rate [F(1, 125) = 1.087, p = 0.299] and Mean RR interval [F(1, 125) = 0.770, p = 0.382].
Group Differences in HRV at Baseline: To investigate which HRV parameters separate between depressive patients (DEP) and healthy controls (HC) we conducted an ANOVA for mean differences between both groups at T1. Group differences in HF power in % [F(1, 125) = 15.029, p = 0.000, Eta2 = 0.115] were highly significant. Group differences in SD1 [F(1, 125) = 4.909, p = 0.029, Eta2 = 0.034], RMSSD [F(1, 125) = 4.909, p = 0.029, Eta2 = 0.038] and LF power in % [F(1, 125) = 4.605, p = 0.23, Eta2 = 0.04] were significant. Age and sex as confounding variables were not significant. Means and Standard Errors for time domain, frequency domain and non-linear parameters for DEP vs. HC at T1 and for repeated measurements (DEPT1 vs. DEPT2) are presented in Table 2. Furthermore, we performed binary logistic regressions analyses to predict group assignment to HC and DEP from HRV parameters. HF power in % predicted group assignment to the HC vs. DEP sample (X2 = 15.517, df = 1, p = 0.000) explaining 62.2% of all variance. Also LF power in % (X2 = 5.137, df = 1, p = 0.023, explained variance = 51.2%) and SD1 (X2 = 6.154, df = 1, p = 0.013, explained variance = 51.2%) significantly predicted group assignment. The simple regression analyses to predict symptom severity from HRV parameters within the depressive sample did not show significant results.
Changes in HRV and Depression Severity: Assessing changes in symptom severity of depression between T1 and T2 within the depressive sample (DEP), the Repeated Measurements ANOVAs revealed highly significant differences with moderate to high effect sizes in self-rated (BDI-II) as well as observer-rated (HDRS, IDS-C) instruments. Results are displayed in Table 3. Repeated Measurements ANOVAs revealed changes in HRV parameters within the depressive sample (DEP, for results see Table 2). Differences between time points for HF power in % [F(1, 52) = 33,180, p = 0.000, Eta2 = 0.39] and SD1/SD2 Ratio [F(1, 52) = 14,773, p = 0.001, Eta2 = 0.221] were highly significant with moderate effect size. Differences between time points for HF power in n.u. [F(1, 52) = 12,375, p = 0.001, Eta2 = 0.192] and SD2 [F(1, 52) = 13,019, p = 0.001, Eta2 = 0.2] were significant with moderate effect size. In addition differences between time points for LF power in n.u. [F(1, 52) = 14,773, p = 0.001, Eta2 = 0.19] were significant with moderate effect size. Age and heart rate were not identified as confounders. We found a significant interaction of sex and HF power in % [F(1, 51) = 5.075, p = 0.029, Eta2 = 0.091]. The difference in HF power values between sexes at T1 [Mmales = 26.975(SE = 2.885), Mfemales = 32.742 (SE = 3.053)] was more pronounced at T2 [Mmales = 38.376 (SE = 3.634), Mfemales = 57.498 (SE = 3.846)]. To appraise normalization of HRV parameters we conducted ANOVA for group differences between T1 HC and T2 DEP. No significant group differences were found. Furthermore, we aimed to test our hypothesis that change in HRV parameters correlate with change in symptom severity of depression after 2 weeks of antidepressant treatment. Point-Biserial correlations were run to determine the relationship between changes in HRV parameters and changes in symptom severity of depression indexed by reduction in sum scores of HDRS, BDI-II and IDS-C. Only results for Delta HF power were significant, age and sex as confounding variables were not significant (for results see Table 4).
Furthermore, we conducted exploratory analyses to investigate relationships between HRV parameters and other variables, such as severity of depression and subtypes of depression (atypical vs. melancholic subtype), which did not reveal significant results.
원문 발췌 · Hartmann R, Schmidt FM, Sander C, Hegerl U, Front Psychiatry 2018 · CC BY 4.0 라이선스에 따라 수정 없이 인용했습니다(본문 속 인용 번호는 생략).
[5]Osimo EF, Baxter LJ, Lewis G, Jones PB, Khandaker GM. Prevalence of low-grade inflammation in depression: a systematic review and meta-analysis of CRP levels. Psychol Med. 2019;49(12):1958-1970. doi:10.1017/s0033291719001454. PMID: 31258105.
초록 (Abstract)
Background: Peripheral low-grade inflammation in depression is increasingly seen as a therapeutic target. We aimed to establish the prevalence of low-grade inflammation in depression, using different C-reactive protein (CRP) levels, through a systematic literature review and meta-analysis.
Methods: We searched the PubMed database from its inception to July 2018, and selected studies that assessed depression using a validated tool/scale, and allowed the calculation of the proportion of patients with low-grade inflammation (CRP >3 mg/L) or elevated CRP (>1 mg/L).
Results: After quality assessment, 37 studies comprising 13 541 depressed patients and 155 728 controls were included. Based on the meta-analysis of 30 studies, the prevalence of low-grade inflammation (CRP >3 mg/L) in depression was 27% (95% CI 21–34%); this prevalence was not associated with sample source (inpatient, outpatient or population-based), antidepressant treatment, participant age, BMI or ethnicity. Based on the meta-analysis of 17 studies of depression and matched healthy controls, the odds ratio for low-grade inflammation in depression was 1.46 (95% CI 1.22–1.75). The prevalence of elevated CRP (>1 mg/L) in depression was 58% (95% CI 47–69%), and the meta-analytic odds ratio for elevated CRP in depression compared with controls was 1.47 (95% CI 1.18–1.82).
Conclusions: About a quarter of patients with depression show evidence of low-grade inflammation, and over half of patients show mildly elevated CRP levels. There are significant differences in the prevalence of low-grade inflammation between patients and matched healthy controls. These findings suggest that inflammation could be relevant to a large number of patients with depression.
결과 (Results)
The literature search yielded 1545 results, out of which 37 studies met the inclusion criteria for meta-analysis (Legros et al.,; Penninx et al.,; Ladwig et al.,; Liukkonen et al.,; O'brien et al.,; Almeida et al.,; Kling et al.,; Danese et al.,; Nilsson et al.,; Cizza et al.,; Harley et al.,; Ma et al.,; Naghashpour et al.,; Hannestad et al.,; Raison et al.,; Shanahan et al.,; Park et al.,; Uher et al.,; Wium-Andersen et al.,; Courtet et al.,; Wysokiński et al.,; Cepeda et al.,; Haroon et al.,; Rapaport et al.,; Shin et al.,; Ekinci and Ekinci,; Euteneuer et al.,; Gallagher et al.,; Horsdal et al.,; Jha et al.,; Cáceda et al.,; Chamberlain et al.,; Felger et al.,; Osimo et al.,; Porcu et al.,; Shibata et al.,; Wei et al., ). Please see Supplementary Fig. S1 for the PRISMA diagram of study selection, and Table 1 for details of the included studies.
Prevalence of low-grade inflammation (CRP >3 mg/L) in depressed patients / Results based on all available studies: Thirty studies comprising 11 813 patients with depression were used for this analysis. The meta-analytic pooled prevalence of low-grade inflammation in depressed patients was 27% (95% CI 21–34%); see Fig. 1. There was evidence of heterogeneity among studies (I2 = 97.7%; 95% CI 97.3–98.1%; Cochrane's Q = 1264; p = <0.01). Further analyses after grouping studies by setting showed that the prevalence of inflammation in inpatient samples (N = 1265) was 30% (95% CI 21–42%; I2 = 91.9%; Cochrane's Q = 62); in outpatient samples (N = 3528) it was 29% (95% CI 19–43%; I2 = 95.9%; Cochrane's Q = 338); and in population-based samples (N = 7020) it was 24% (95% CI 17–34%; I2 = 98.3%; Cochrane's Q = 483).
Analyses excluding poor quality studies or cases with past depression: A sensitivity analysis excluding six poor quality studies, comprising 8778 patients, showed that the prevalence of inflammation was 27% (95% CI 22–33%); Supplementary Table S1 and Fig. S2. There was evidence of heterogeneity (I2 = 96.4%; 95% CI 95.5–97.1%; Cochrane's Q = 644; p = <0.01). A sensitivity analysis excluding two studies where depression was not active in all patients, comprising 11 763 patients, showed that the prevalence of inflammation was 26% (95% CI 20–34%); Supplementary Fig. S3. There was evidence of heterogeneity (I2 = 97.9%; 95% CI 97.4–98.2%; Cochrane's Q = 1261; p = <0.01).
Analysis after excluding cases of suspected infection (CRP >10 mg/L): Nine studies reported the prevalence of low-grade inflammation after excluding participants with suspected infection, defined as CRP >10 mg/L. A separate meta-analysis based on these studies, comprising 6948 patients, showed that the prevalence of inflammation was 16% (95% CI 8–32%); Supplementary Fig. S4. There was evidence of heterogeneity (I2 = 98.8%; 95% CI 98.5–99.1%; Cochrane's Q = 675; p = <0.01).
Association between prevalence of low-grade inflammation (CRP >3 mg/L) and characteristics of depressed patients: Meta-regression was used on 19 studies comprising 7858 patients to test the association between the prevalence of inflammation and the proportion of patients who were antidepressant-free at the time of study. There was no association between these factors (estimate: −0.007; z = −1.03; p = 0.30). Similarly, sex, age, non-White ethnicity, BMI and sample source (inpatient, outpatient or population-based) were not associated with the prevalence of inflammation (see Supplementary Results).
Assessment of publication bias: A funnel plot of the 30 studies assessing the prevalence of low-grade inflammation (CRP >3 mg/L) in depression visually appeared symmetrical (Supplementary Fig. S5). Egger's regression test for funnel plot asymmetry was non-significant (t = −1.3; df = 28; p = 0.21), suggesting there was no evidence of publication bias.
Odds ratio for low-grade inflammation (>3 mg/L) in depressed patients: Seventeen studies reported the prevalence of inflammation in 7761 depressed patients and 155 728 matched non-depressed controls (see Supplementary Table S2 for matching details). The meta-analytic OR for inflammation in depressed patients compared with matched controls was 1.46 (95% CI 1.22–1.75; p < 0.0001); see Fig. 2. There was evidence of heterogeneity (I2 = 71.9%; 95% CI 54.3–82.7%; Cochrane's Q = 57; p = <0.01).
Based on the same studies, we meta-analysed the prevalence of inflammation in depressed patients and matched non-depressed controls separately. The prevalence of inflammation in controls was 16% (95% CI 11–23%) and that in depressed patients was 24% (95% CI 17–34%); see Supplementary Figs S6 and S7.
We carried out sensitivity analyses based on five available studies of depressed patients and matched healthy controls that excluded subjects with very high levels of CRP (>10 mg/L). These studies, comprising 3868 patients and 63 212 controls, showed that the prevalence of inflammation in controls was 10% (95% CI 3–26%) and that in patients it was 13% (95% CI 4–36%); see Supplementary Figs S8 and S9. Based on these studies, the meta-analytic OR for inflammation in depressed patients compared with matched controls was 1.44 (95% CI 0.80–2.61; p = 0.23); see Supplementary Fig. S10.
A sensitivity analysis excluding poor quality studies, comprising 5045 patients and 105 372 controls, showed that the meta-analytic OR for inflammation in depressed patients compared with matched controls was 1.56 (95% CI 1.29–1.88; p < 0.0001); see Supplementary Table S1 and Fig. S11. A further sensitivity analysis only including studies that matched patients and controls by BMI, comprising 2624 patients and 79 887 controls, showed that the meta-analytic OR for inflammation in depressed patients compared with matched controls was 1.59 (95% CI 1.08–2.34; p = 0.02); see Supplementary Fig. S12. Finally, a sensitivity analysis excluding studies where depression was not active in all patients showed that the meta-analytic OR for inflammation in depressed patients compared with matched controls was 1.47 (95% CI 1.22–1.75; p = 0.02); see Supplementary Fig. S13.
Prevalence of elevated CRP levels (>1 mg/L) in depressed patients / Results based on all available studies: Twenty-five studies comprising 8887 patients with depression were used for this analysis. The meta-analytic pooled prevalence of elevated CRP >1 mg/L in depressed patients was 58% (95% CI 47–69%); see Fig. 3. There was evidence of heterogeneity (I2 = 98.7%; 95% CI 98.5–98.9%; Cochrane's Q = 1862; p = <0.01). Further analyses after grouping studies by setting showed that the prevalence of elevated CRP in inpatient samples (N = 1023) was 56% (95% CI 46–66%; I2 = 81.8%; Cochrane's Q = 22); in outpatient samples (N = 697) was 59% (95% CI 50–67%; I2 = 74.9%; Cochrane's Q = 40); and in population-based samples (N = 7167) was 57% (95% CI 34–77%; I2 = 99.5%; Cochrane's Q = 1774).
Analyses excluding poor quality studies or cases with past depression: A sensitivity analysis excluding four poor quality studies showed that the prevalence of elevated CRP >1 mg/L in depressed patients was 57% (95% CI 43–69%); Supplementary Table S1 and Fig. S14. There was evidence of heterogeneity (I2 = 98.9%; 95% CI 98.7–99.1%; Cochrane's Q = 1858; p = <0.01). A further sensitivity analysis excluding studies where depression was not active in all patients showed that the prevalence of elevated CRP in depressed patients was 58% (95% CI 45–69%); Supplementary Fig. S15. There was evidence of heterogeneity (I2 = 98.8%; 95% CI 98.6–99.0%; Cochrane's Q = 1861; p = <0.01).
Analysis after excluding cases of suspected infection (CRP>10 mg/L): Eight studies also reported the prevalence of elevated CRP after excluding participants with suspected infection, defined as CRP >10 mg/L. A separate meta-analysis based on these studies, comprising 4456 patients that excluded patients with CRP levels >10 mg/L showed that the prevalence of elevated CRP >1 mg/L was 50% (95% CI 29–72%); see Supplementary Fig. S16 There was evidence of heterogeneity (I2 = 99.1%; 95% CI 98.9–99.3%; Cochrane's Q = 816; p = <0.01).
Association between prevalence of elevated CRP levels (>1 mg/L) and characteristics of depressed patients: Meta-regression analyses did not find any significant association of elevated CRP with sex, age, BMI, non-White ethnicity, being antidepressant-free or sample source (see Supplementary Results).
Assessment of publication bias: A funnel plot of the 25 studies assessing the prevalence of elevated CRP in depression appeared visually symmetrical. Egger's regression test for funnel plot asymmetry was non-significant (t = −0.43; df = 23; p = 0.67), suggesting there was no evidence of publication bias (Supplementary Fig. S17).
Odds ratio for elevated CRP levels (>1 mg/L) in depressed patients: Fifteen studies reported the prevalence of elevated CRP >1 mg/L in 5177 depressed patients and 106 682 matched non-depressed controls (see Supplementary Table S2 for matching details). The meta-analytic OR for elevated CRP in depressed patients compared with matched controls was 1.47 (95% CI 1.18–1.82; p = 0.0005); see Fig. 4. There was evidence of heterogeneity (I2 = 75.6%; 95% CI 59.8–85.2%; Cochrane's Q = 57; p = <0.01).
Based on the same studies, we meta-analysed the prevalence of elevated CRP in depressed patients and matched non-depressed controls separately. The prevalence of elevated CRP >1 mg/L in controls was 44% (95% CI 26–65%) and that in depressed patients was 59% (95% CI 41–75%); see Supplementary Figs S18 and S19.
A sensitivity analysis based on 12 studies after excluding poor quality studies showed that the meta-analytic OR for elevated CRP in depressed patients compared with matched controls was 1.51 (95% CI 1.22–1.88; p = 0.0002); see Supplementary Table S1 and Fig. S20. A sensitivity analysis only including the nine studies that matched the patients and controls by BMI showed that the meta-analytic OR for elevated CRP >1 mg/L in depressed patients compared with matched controls was 1.52 (95% CI 1.12–2.07; p = 0.01); see Supplementary Fig. S21. A further sensitivity analysis excluding studies where depression was not active in all patients showed that the meta-analytic OR for elevated CRP in depressed patients compared with healthy controls was 1.47 (95% CI 1.19–1.81; p = 0.0003); see Supplementary Fig. S22. Finally, a sensitivity analysis of the four studies excluding subjects with very high levels of CRP (>10 mg/L) showed that the meta-analytic OR for elevated CRP in depressed patients compared with healthy controls was 1.29 (95% CI 0.38–4.30; p = 0.68); see Supplementary Fig. S23.
Very high CRP levels (>10 mg/L) in depressed patients and healthy controls: We used data from four available studies comprising 3926 patients and 62 748 matched healthy controls. The meta-analytic pooled prevalence of very high CRP in depressed patients matched to healthy controls was 3% (95% CI 1–11%); in the same studies, prevalence of very high CRP in healthy controls matched to depressed patients was 1% (95% CI 0–4%); the meta-analytic OR for very high CRP in depressed patients compared with matched controls was 1.52 (95% CI 1.13–2.05; p = 0.006); see Supplementary Figs S24–26.
원문 발췌 · Osimo EF, Baxter LJ, Lewis G, Jones PB, Khandaker GM, Psychol Med 2019 · CC BY 4.0 라이선스에 따라 수정 없이 인용했습니다(본문 속 인용 번호는 생략).
[6]Rush AJ, Trivedi MH, Wisniewski SR, Nierenberg AA, Stewart JW, Warden D, et al. Acute and longer-term outcomes in depressed outpatients requiring one or several treatment steps: a STAR*D report. Am J Psychiatry. 2006;163(11):1905-1917. doi:10.1176/ajp.2006.163.11.1905. PMID: 17074942.
요약 미국 외래 우울증 환자 3,671명이 최대 네 단계까지 약을 바꿔 가며 치료받은 대규모 연구(STAR*D)입니다. 단계별 관해율은 첫 단계 36.8%, 둘째 30.6%, 셋째 13.7%, 넷째 13.0%였고, 네 단계를 모두 합친 누적 관해율은 67%였습니다. 더 많은 단계가 필요했던 환자일수록 이후 재발률이 높았습니다.원문은 출판사 저작권 자료로, 위 링크에서 확인하실 수 있습니다.
[7]Pearce M, Garcia L, Abbas A, Strain T, Schuch FB, Golubic R, et al. Association Between Physical Activity and Risk of Depression: A Systematic Review and Meta-analysis. JAMA Psychiatry. 2022;79(6):550-559. doi:10.1001/jamapsychiatry.2022.0609. PMID: 35416941.
초록 (Abstract)
This systematic review and meta-analysis examines data from published prospective studies of adults to gauge the dose-response association between physical activity and incident depression.
결과 (Results)
Literature Search: The systematic literature search yielded 19 175 results following removal of duplicates. After excluding 18 827 records based on title and abstract screening, 348 full-text articles were reviewed. Full-text screening identified 15 eligible publications reporting 15 associations including 191 130 participants contributing 28 806 incident depression events and 2 110 588 person-years. Approximately 64% of participants in the studies were women. All but 1 of the included studies originated in high-income countries: 6 from the United States, 6 from Europe, 1 from Australia, 1 from Japan, and 1 study that included data from India, Ghana, Mexico, and Russia. Study characteristics are described in Table 1.
Dose-Response Analyses: The majority (78%) of participants reported exposure levels below 17.5 mMET hours per week, with almost all (95%) data below 35 mMET hours per week; participants in studies of elevated depressive symptoms tended to be less active than those in studies of major depression (eFigure 2 in the Supplement). Figure 1 shows an inverse, curvilinear dose-response association between physical activity and depression, with greater differences in risk in the lower-dose region. Relative to adults not reporting any activity, those accumulating half the recommended volume of physical activity (4.4 mMET-h/wk) had 18% (95% CI, 13%-23%) lower risk of depression. Adults accumulating the recommended volume of 8.8 mMET hours per week had 25% (95% CI, 18%-32%) lower risk with diminishing potential benefits and higher uncertainty observed beyond that exposure level (Table 2). Interactive dose-response curves and exposure distributions are available online. The dose-response curves for major depression and elevated depressive symptoms showed similar curvilinear relationships (Table 2 and Figure 2).
Estimated Population Risk: Based on PIF analyses of prevalences of physical activity and depression outcomes in the included cohorts, 11.5% (95% CI, 7.7%-15.4%) of incident depression could have been prevented if all adults had achieved at least 8.8 mMET hours per week of physical activity (Table 2). PIFs were approximately twice as high for elevated depressive symptoms than for major depression at both 8.8 and 17.5 mMET hours per week and approximately 3 times higher at 4.4 mMET hours per week (Table 2).
Sensitivity Analyses: Using alternative assumptions of 0.5 hours for session duration and 1 MET lower-intensity values for moderate and vigorous physical activity (only when those assumptions were necessary) or alternative placement of knots for the splines did not materially alter dose-response associations (eTable 3 in the Supplement) or PIFs (eTable 4 in the Supplement).
Analysis of Heterogeneity: Differences between proportion of women, exposure harmonization method, outcome ascertainment, duration of follow-up, exclusion of prevalent cases at baseline, or managing other morbidities at baseline did not significantly explain variance in the effect measures of associations between physical activity and depression (eFigure 3 in the Supplement). The leave-one-out sensitivity analysis did not identify any outliers (eFigure 4 in the Supplement).
원문 발췌 · Pearce M, Garcia L, Abbas A, Strain T, Schuch FB, Golubic R, Kelly P, Khan S, Utukuri M, Laird Y, Mok A, Smith A, Tainio M, Brage S, Woodcock J, JAMA Psychiatry 2022 · CC BY 4.0 라이선스에 따라 수정 없이 인용했습니다(본문 속 인용 번호는 생략).