

아침에 일어나도 잔 것 같지 않고, 주말 내내 쉬어도 월요일이면 다시 천근만근입니다. 검사는 정상이라는데 몸은 점점 방전되어 갑니다. 쉬어도 풀리지 않는 이 상태가 만성피로입니다.
만성피로 한눈에 보기
- 만성피로는 충분히 쉬어도 풀리지 않는 피로가 여섯 달 넘게 이어져 일상을 무너뜨리는 상태입니다.
- 피로로 병원을 찾은 분 가운데 심각한 신체 질환은 약 4%이고, 우울증은 18.5%로 더 많습니다.
- 수면, 스트레스, 소화, 자율신경의 균형이 얽혀 있어, 떨어진 회복력을 되찾는 방향으로 치료해야 합니다.
- 치료후기 47건
- 의료진 칼럼 2편
- 건강정보 13편
- 온라인 상담 3건
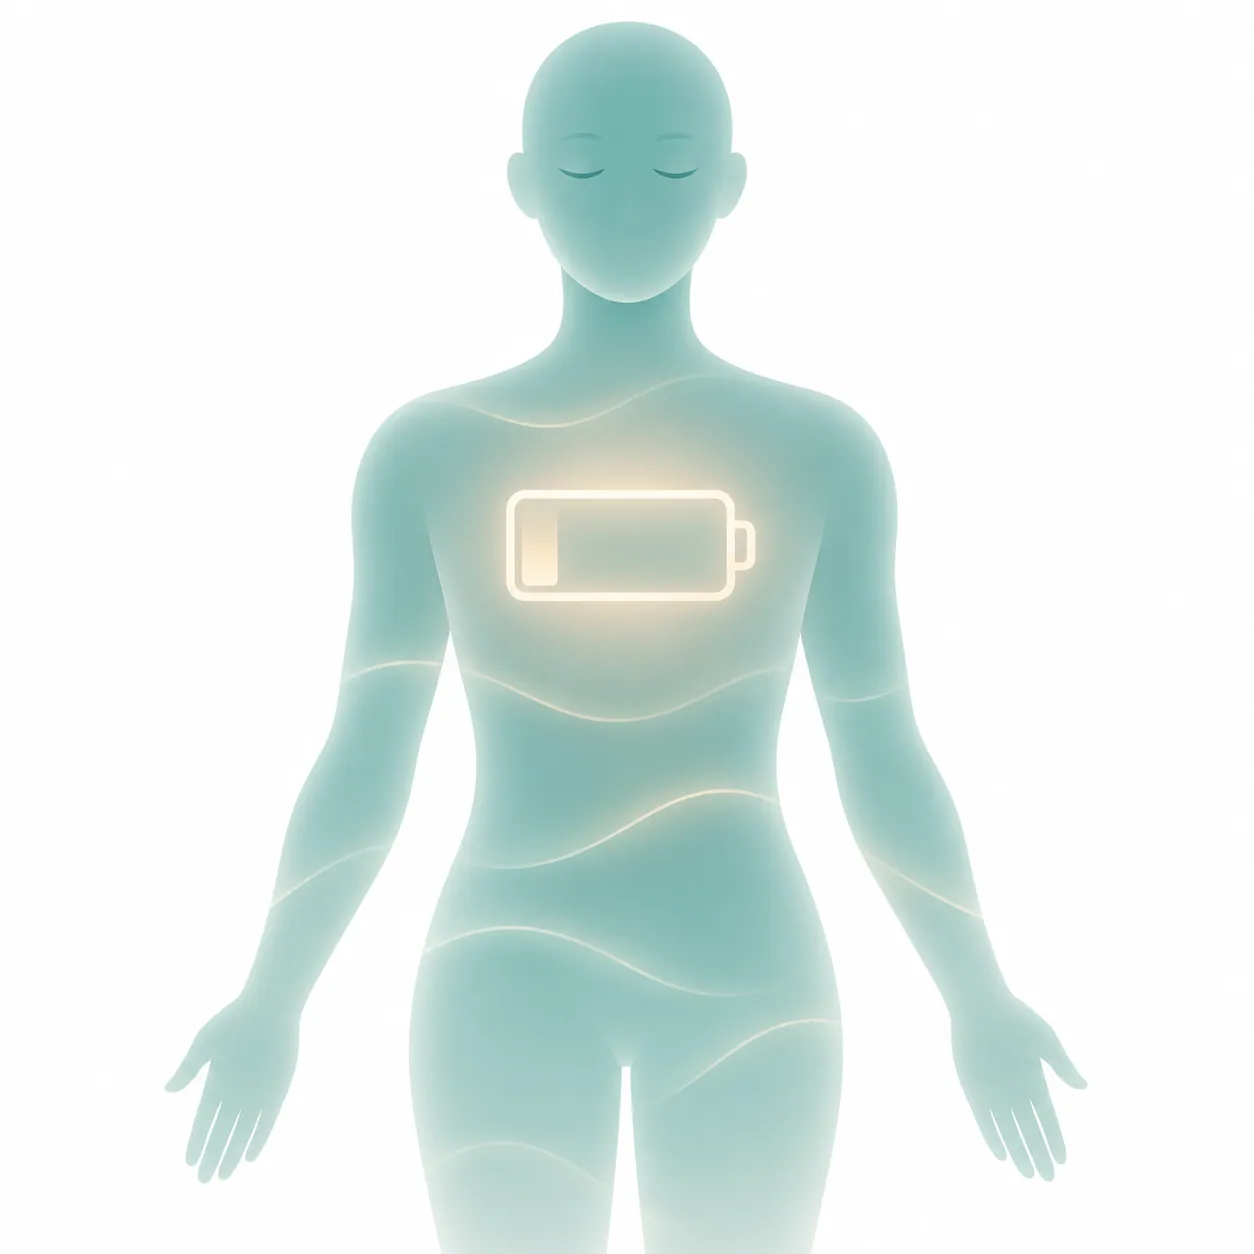
이런 증상이 있나요?
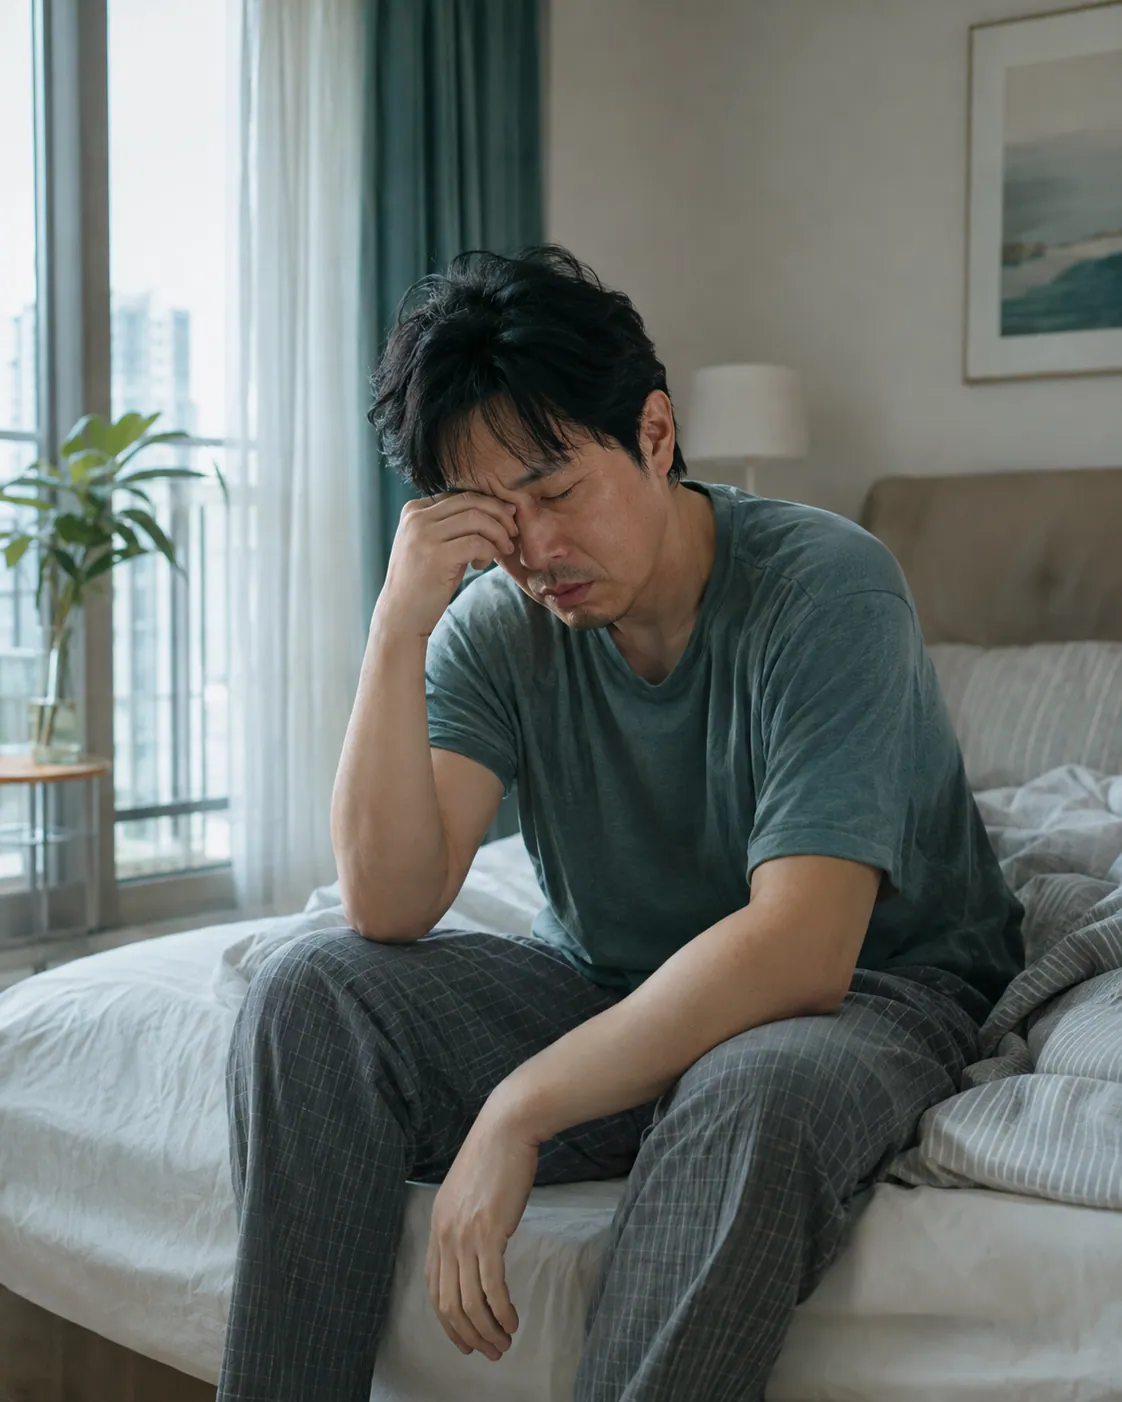
- 자고 일어나도 개운하지 않고 몸이 무겁다
- 오후가 되면 눈을 뜨고 있기도 힘들다
- 조금만 무리해도 며칠씩 앓는다
- 머리가 멍하고 집중이 안 되며 자꾸 깜빡한다
- 목과 어깨가 뭉치고 온몸이 쑤신다
- 입맛이 없고 소화가 잘 안 된다
- 감기나 입병이 자주 생긴다
만성피로는 왜 생기나요?
- 잠이 모자라거나 깊이 못 자는 수면 문제
- 과로와 쉬지 못하는 스트레스
- 불규칙한 식사, 소화 불량
- 감기나 코로나를 앓은 뒤의 후유증
- 우울과 불안
- 빈혈, 갑상선 질환 같은 몸의 병
피로가 오래가면 먼저 빈혈, 갑상선 질환 같은 몸의 병이 있는지 기본 검사로 확인합니다. 다행히 피로로 병원을 찾은 분 가운데 빈혈은 2.8%, 암은 0.6%, 심각한 신체 질환을 모두 합해도 4.3%였습니다. 그래서 특별한 이상 소견이 없다면 광범위한 검사보다 생활과 마음의 상태를 살피는 쪽이 권장됩니다[1].
스트레스와 만성피로는 어떤 관계일까요?
우리의 몸은 긴장하는 교감신경과 쉬게 하는 부교감신경이 번갈아 일하며 회복합니다. 스트레스와 과로가 오래가면 쉬어야 할 때도 긴장이 풀리지 않아, 자도 회복이 되지 않습니다. 실제로 만성피로증후군 환자는 건강한 사람보다 가만히 있을 때의 심박수가 높고 심장의 자율신경 조절이 달라져 있습니다[3]. 검사 수치는 정상이어도 몸이 쉬는 상태로 돌아가지 못하는 것입니다.
만성피로의 표준 치료
원인 질환이 있다면 그 치료가 먼저입니다. 뚜렷한 질환이 없는 만성피로에는 수면과 생활 습관을 바로잡고, 우울이나 불안이 있으면 함께 치료합니다. 다만 피로 자체를 없애는 약은 없어서, 영양제와 커피로 버티다가 다시 지치는 분이 많습니다.
만성피로는 기운을 잠깐 끌어올리는 것이 아니라 스스로 회복하는 힘을 되찾아야 합니다. 한의학 치료는 바로 이 바탕을 다스립니다. 위에 말한 세 가지 유형에 맞는 근본 원인을 바로잡는 방향으로 치료합니다.
연구도 쌓이고 있습니다. 침과 뜸을 다룬 31개 연구를 모은 분석에서 유효율은 양약보다 1.51배, 가짜 침보다 5.9배 높았습니다[4]. 인삼은 우리나라 환자 90명을 대상으로 한 연구에서 전체 피로 점수는 위약과 차이가 없었지만, 정신적 피로 점수는 더 좋아졌습니다[5].
해움한의원은 이렇게 치료합니다

해움한의원은 피로만 쫓지 않고, 몸이 회복하지 못하는 이유를 찾아 함께 치료합니다.
1단계. 피로의 원인과 유형을 가립니다
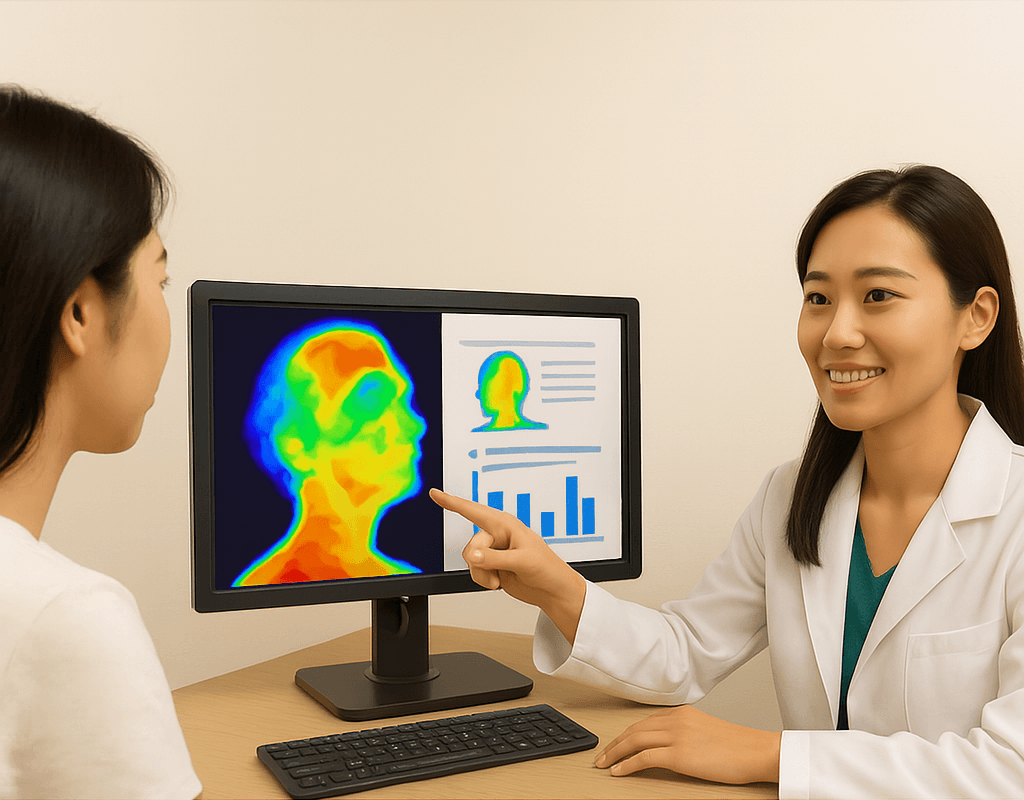
언제부터 어떻게 피곤한지, 수면과 식사, 스트레스 상태를 자세히 살펴봅니다. 혈액검사 결과를 함께 보고, 다른 질환이 의심되면 해당 진료를 안내해 드립니다. 심박변이도와 뇌파, 체열검사로 자율신경의 상태를 확인합니다.
2단계. 굳은 긴장을 풉니다
침과 약침으로 목·어깨와 등의 긴장을 풀고, 몸이 쉬는 상태로 돌아가도록 자율신경의 균형을 돕습니다.
3단계. 유형에 맞춰 회복력을 채웁니다
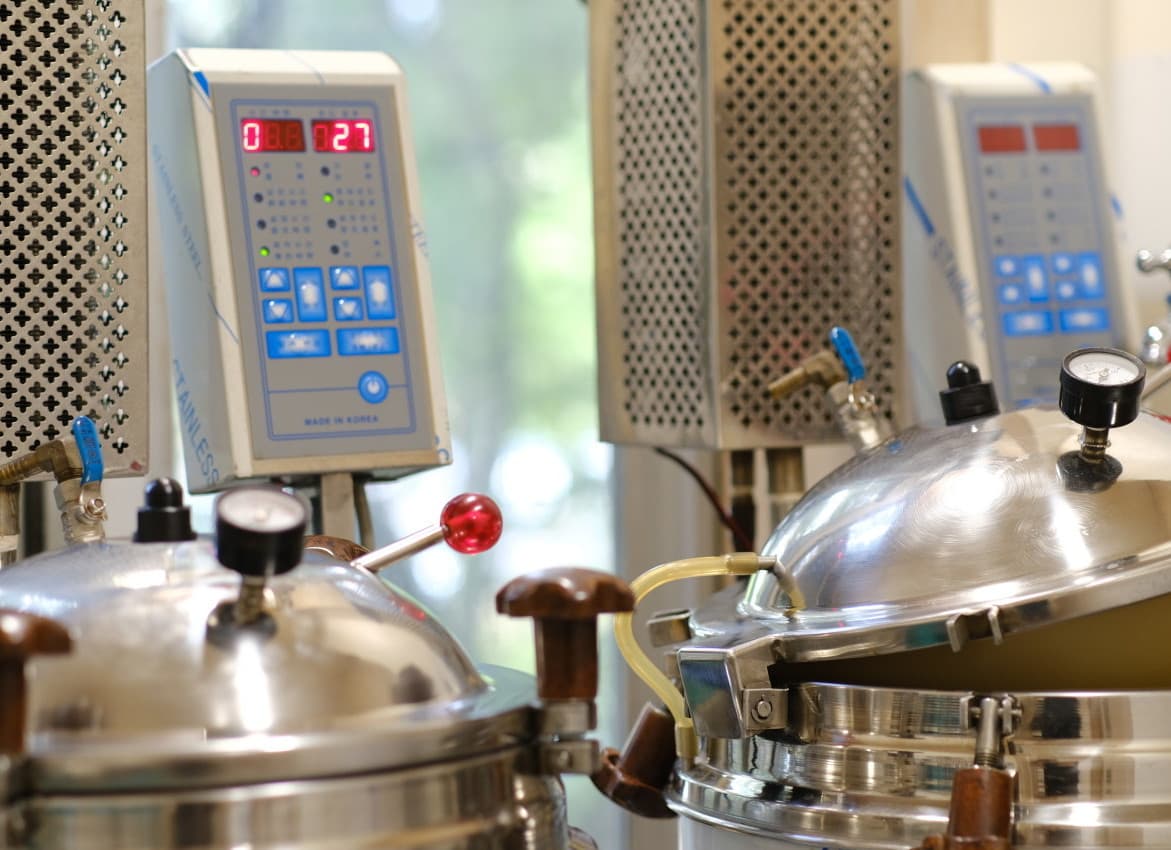
체질과 상태에 맞춰 한약을 짓습니다. 수면과 식사, 활동량도 함께 조절합니다.
4만 건의 처방 사례가 말해주는, 한방 맞춤 치료의 힘


만성피로 치료후기 총 47건
환자분들이 남긴 치료후기입니다. 본문은 로그인 후 보실 수 있습니다.

갑상샘항진증 아급성갑상선염 치료 환자, 피로감 소화불량 고지혈증 완화 한약 2달간
2025. 01. 25.
스트레스인지 코로나후유증인지.. 왼쪽가슴통증손저림 만성피로 염증 한 방에!
2023. 01. 18.
이럴때 보약한재 먹어야해요! 만성피로 편두통 몸살근육통
2023. 01. 17.
이게 바로 산후풍? 출산 후 관절통, 피로, 무기력 한약 1달
2022. 05. 18.

선생님 덕분에 수능 너무 잘봤어요!! 수험생 피로보약,과민대장증후군
2022. 05. 13.
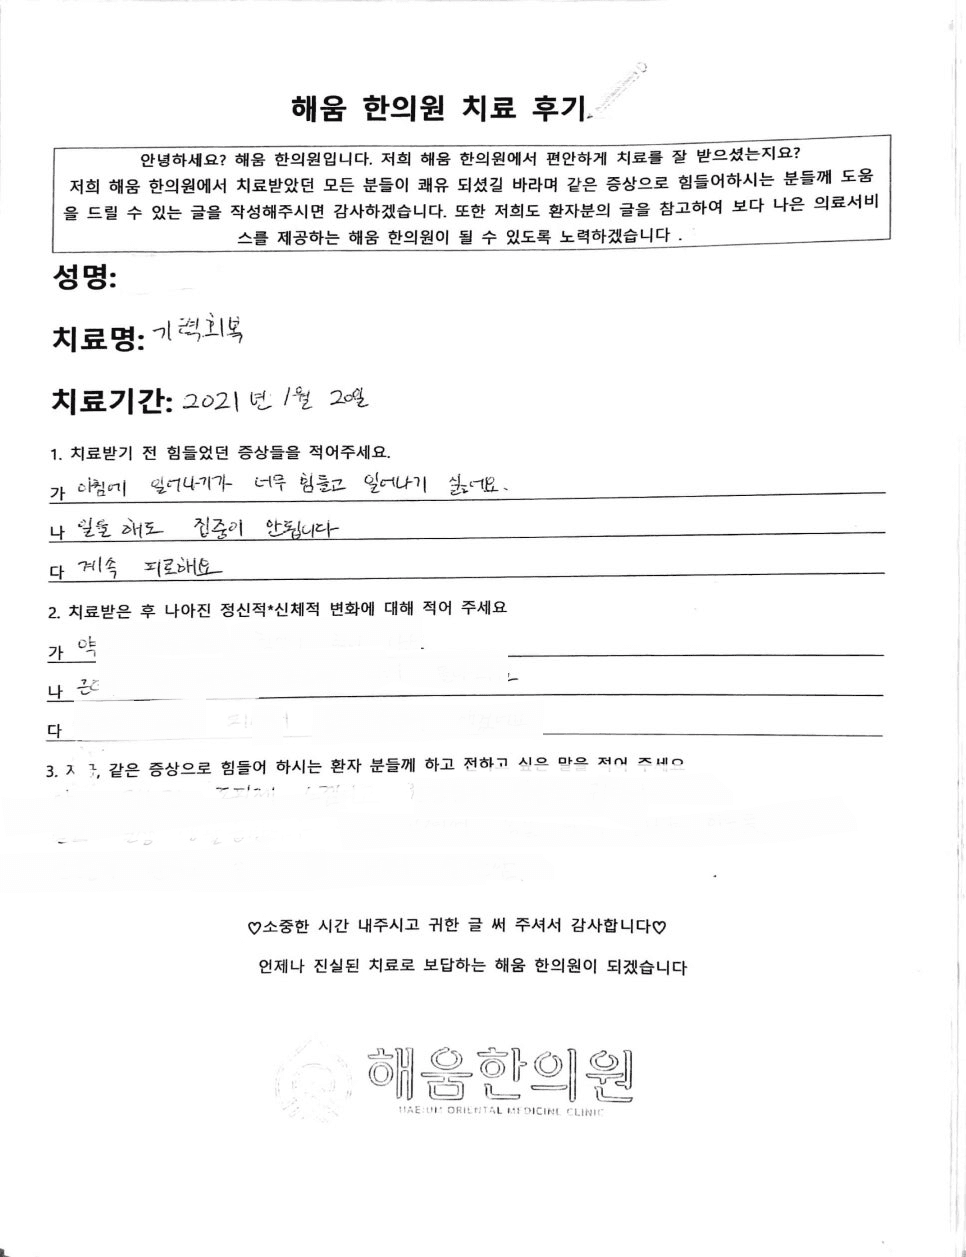
일어나기 싫고 집중도 안 되고 그냥 매일 피곤해요!! 만성피로 환자 치료기
2022. 04. 02.
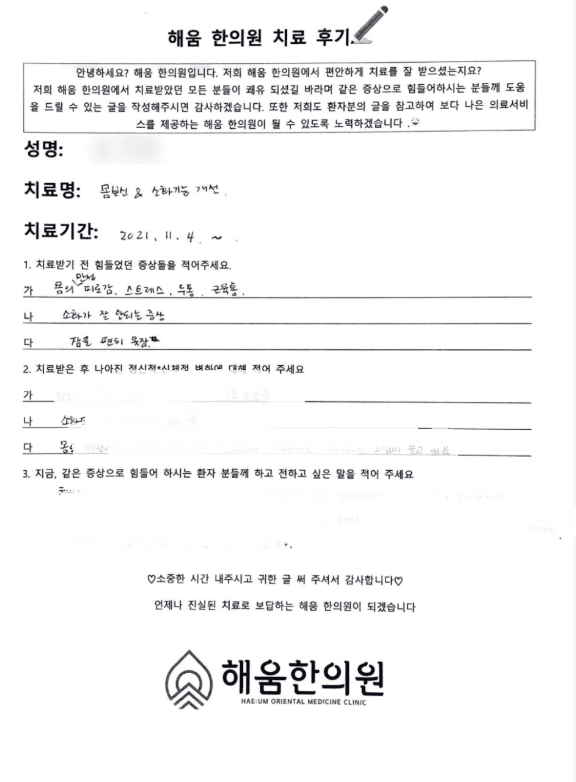
다른 증상으로 내원하신 분들의 후기 중 ‘만성피로’가 증상으로 함께 언급된 기록
- 입대 전 갑자기 발생한 과민성대장증후군, 한의원에서 치료가 될까요?2026. 06. 01.
- 갑자기 화장실을 못참겠다면? 과민성대장증후군가스잦은설사 한약으로 치료가 될까요? 과민성대장증후군병원2026. 05. 27.
- 코로나 백신 맞고 기억이 안날 때는? 머리가 멍해요. 코로나 브레인포그 후유증 브레인포그 극복 혈관성 치매 한의원 후기2026. 05. 04.
- 갑자기어지럽고식은땀이 흐른다구요?2026. 04. 25.
- 재수생에게 갑자기 찾아온 스트레스심장두근거림과 급체이유는 뭘까요?2026. 04. 14.
- 명치답답 소화불량, 담적 증상 같은데 원인이 없대요. 정신과 문제인 걸까요?2026. 01. 31.
- 건선치료제로 효과 없는 피부건선, 한약 6개월2026. 01. 28.
- 시험만 보려고 하면 배가 아프고 설사하고 심장이 두근거려요2026. 01. 19.
- 심장이 철렁하고 가슴이 아파요..심장뻐근함도 한약으로 치료가 되나요?2026. 01. 12.
- 검사는 이상 없는데 복통이 심해요..제가 예민한 걸까요?2026. 01. 09.
나머지 30건 더 보기접기
- 직장 스트레스와 과로로 악화된 편두통·삼차신경통 환자2026. 01. 06.
- 소화불량두통, 체할까 봐 항상 조심스러웠던 마음이 이제는 편해졌어요2026. 01. 05.
- 극심한 생리통, 알고보니 자궁물혹이래요.. 아랫배 빵빵 생리통 심해짐, 한약으로 생리통 없어짐 가능할까요?2025. 12. 27.
- 명치끝 통증, 알고보니 자궁내막암 후유증이었다고?2025. 07. 08.
- 기침 콧물 멈추는법? 목동 한의원에서 알려주는 코비염 해결법2025. 02. 15.
- 가슴답답 호흡곤란 공황장애 우울증 심장빨리뜀 우측 아랫배 통증 한의원 4개월2024. 12. 18.
- 코로나 후유증 가슴두근거림, 불면2024. 06. 27.
- 어깨 수술 후 악화된 이석증 어지러움 한약 치료 후기2024. 05. 21.
- 코로나로 악화된 이명 코로나후유증 한약 6개월2024. 04. 21.
- 홧병으로 두근거리고 심장저림까지 있던 환자분 사례2023. 12. 09.
- 코로나로 악화된 공황장애 분열정동장애 한약 6개월2023. 11. 22.
- 건선치료제로 효과 없는 피부건선, 한약 6개월 치료 사례.. 자율신경이 면역과 건선 혈액순환에 미치는 영향2023. 01. 17.
- 성인아토피? 아기아토피? 한약 치료 후 어릴때부터 있던 아토피 흉터 깔끔하게 사라진 사례2023. 01. 15.
- 심장이 철렁, 심장두근거림이 너무 심하고 가슴통증까지 와요2023. 01. 10.
- 3개월간 고생한 옆구리통증 명치통증 호흡곤란 소화불량 1달만에2022. 12. 29.
- 스트레스성 공황장애 초기증상 한약 치료사례: 공황발작과 공황장애의 차이2022. 12. 27.
- 얼굴이 화끈거리고 어지럽고 불면증을 동반한 이석증2022. 08. 19.
- 가슴두근거림,무기력,우울증,체력저하 한약 치료기2022. 06. 27.
- 잠을 못 잘 정도의 피부 알러지 아토피2022. 06. 23.
- 심박수가 120까지.. 코로나 확진 후 두근거림 숨이차고 소화가 안 되었는데 한약치료로 좋아졌어요2022. 06. 02.
- 한랭두드러기로 인한 간지럼증 1달2022. 05. 24.
- 3주만에 좋아졌어요 스트레스로 인한 소화불량, 불면증2022. 05. 19.
- 오래된 발한 식은땀 소화불량 한약 먹고 10일만에..?!2022. 05. 12.
- 스트레스성 폭식으로 급찐 살 9kg 감량!! 다이어트 성공 사례2022. 04. 04.
- 불면증 한약으로도 치료되나요? 말똥말똥 잠이 안 와서 다음날이 걱정되던 환자2022. 04. 02.
- 잔병치레를 달고 살던 환자분, 한약으로 소화불량 위경련 예민함 치료를 통해 좋아진 사례2022. 03. 07.
- 야간근무로 인해 살찌고 감정기복이 너무 심했던 간호사 환자, 한 포 먹고 식욕이 뚝 떨어지고 마음이 편안해졌다고..2021. 10. 27.
- 주변에선 날씬하다고 하는데, 저는 더 빼고싶어요!! 마른 환자의 아이돌 몸무게 가기2021. 10. 21.
- 10kg 감량! 스트레스로 인한 체중증가, 한약으로 화병과 비만 둘다 관리할 수 있답니다2021. 10. 15.
- 10년 이상 된 소화불량, 무기력하고 우울하던 인생이 바뀌었다는 환자분의 한약 치료 후기2021. 07. 30.
만성피로, 누가 진료하나요?
담당 의료진
대표원장 박재은

“병이 아니라 그 뒤의 사람을 봅니다”
경희대학교 한의과대학에서 석사·박사 과정을 마쳤습니다. 심리상담사 1급 자격과 4만 건 이상의 한약 처방 경험을 바탕으로 진료합니다.
의료진 소개 더보기만성피로, 자주 묻는 질문
피검사가 정상인데 왜 이렇게 피곤한가요?
만성피로와 만성피로증후군은 다른가요?
보약을 먹으면 피로가 풀리나요?
피곤해도 운동을 해야 하나요?
치료 기간은 얼마나 걸리나요?
생활에서 주의할 점이 있나요?
해움한의원에서 만성피로를 진료하나요?
만성피로로 내원하려면 어떻게 하나요?
만성피로에 관해 알아두면 좋은 정보
13건만성피로과 관련해 정리한 건강정보입니다.
미주신경성실신 병원 치료 약 고민 중이라면, 재발 방지까지 함께 봐야 합니다.
“갑자기 어지럽더니 정신을 잃었어요… 왜 이런 일이 생길까요?”평소에는 큰 병 없이 지내다가도,어느 날 갑자기 눈앞이 흐려지고 식은땀이 나면서맥이 풀리듯 주저앉는 일을 겪는 분들이 있습니다.처음에는 단순한 피로라고

눈앞이 빙글 도는 느낌, 이석증전조증상일 수 있습니다
“갑자기 세상이 빙글 도는 느낌, 괜찮은 걸까요?”가만히 있다가 고개를 돌리거나누웠다 일어나는 순간“눈앞이 빙글빙글 돌아요”“몸이 휘청거려서 넘어질 것 같아요”이런 증상이 반복된다면단순 피로나 어지럼증이 아니라이석증

뒷골땡김 머리까지 아프다면, 단순 피로가 아닐 수 있습니다
“뒷골이 당기고 어지럽고, 머리까지 아프다면 불안해질 수밖에 없죠”갑자기 뒷목이 뻣뻣해지면서 뒤통수가 당기고, 동시에 어지럽기까지 하다면 누구나 한 번쯤 이런 생각이 듭니다.“혹시 뇌에 문제가 있는 건 아닐까?”특히

후두신경통주사보다 중요한 것은? 후두신경통한의원에서 찾는 근본 원인
목 뒤가 당기고 두통까지 이어진다면 그냥 피로 때문일까요?"목 뒤가 뻣뻣하게 당겨요.""뒤통수가 쑤시면서 하루 종일 머리가 무거워요.""주사도 맞고 약도 먹었는데 또 아파요."이처럼 목덜미에서 시작된 통증이 뒤통수와

누울때어지러움, 반복된다면 단순 피로가 아닐 수 있습니다
“누우려고만 하면 세상이 빙글 돌고, 일어나면 더 무서워집니다”몸을 눕히는 순간 천장이 빙글 도는 것 같고,자세를 바꾸면 속이 울렁거리면서 금방이라도 토할 것 같은 느낌이 드는 분들이 있습니다.어떤 분들은 잠자리에

출근 생각만 해도 피곤하다면? 번아웃증후군 테스트로 지금 상태를 확인해보세요
“쉬어도 안 풀리고, 뭘 해도 의미가 없다면 몸이 이미 지쳐 있다는 뜻입니다”어느 순간부터 아침에 눈을 뜨는 것 자체가 버겁게 느껴질 때가 있습니다.분명 잠은 잤는데 개운하지 않고, 출근이나 육아, 집안일처럼 해야

뒷목뻐근 두통 어지러움, 자율신경균형이 핵심입니다
“그냥 두통이겠지…” 하고 넘기고 계신가요?뒷목이 뻐근하면서 머리가 지끈거리고, 때로는 어지러움까지 동반되는 경험. 한 번쯤은 있으셨을 거예요.특히 스트레스를 받는 날이면목이 딱딱하게 굳고, 머리가 무겁고, 눈앞이

자꾸 어지러움증, 메니에르병일까요?
“가만히 있어도 빙글빙글 도는 느낌…”일상생활을 하다가 갑자기∙ 세상이 도는 듯한 어지러움∙ 귀가 먹먹한 느낌∙ 소리가 잘 안 들리는 증상이 반복된다면 단순 피로나 컨디션 문제로 보기 어렵습니다.특히 충분히 쉬어도

신경쇠약병원에서 검사 이상 없다고 했는데 계속 힘들다면
이유 없이 예민해지고 쉽게 지친다면, 단순한 피로가 아닐 수 있습니다평소보다 작은 소리에도 깜짝 놀라고, 충분히 쉬었는데도 몸이 무겁고 피곤하신가요?가슴이 이유 없이 두근거리거나 손이 떨리고, 어지럽거나 잠을 깊이

피곤한데잠이안와요불면증, 몸은 지쳤는데 왜 잠은 오지 않을까요?
몸은 너무 피곤한데 잠은 오지 않는다면, 단순한 피로가 아닐 수 있습니다"오늘은 정말 피곤해서 금방 잠들겠지."하지만 막상 침대에 누우면 눈은 말똥말똥하고, 아무리 뒤척여도 잠이 오지 않는 경험을 해보신 적 있으신가

동성서맥 동성빈맥 원인과 증상, 스트레스가 심장 박동까지 바꿉니다
가슴이 이유 없이 두근거리거나 너무 느리게 뛴다면가만히 앉아 있는데도 심장이 빠르게 뛰는 느낌이 들거나, 반대로 몸이 축 처지고 맥박이 지나치게 느리게 느껴질 때가 있습니다.처음에는 단순 피로라고 생각하고 넘기지만

계속 멍하고 집중이 안 된다면? 브레인포그극복의 첫걸음
쉬어도 머리가 맑아지지 않는다면 다른 원인을 찾아야 합니다"분명 충분히 잤는데 머리가 멍해요.""방금 하려던 말을 잊어버렸어요.""책을 읽어도 같은 문장을 여러 번 읽게 됩니다."이런 경험이 반복된다면 단순한 피로나

누웠다일어날때어지러움 , 원인부터 정확히 확인하세요
“일어나는 순간, 세상이 빙글 도는 느낌”누워 있다가 일어날 때“눈앞이 캄캄해져요”“몸이 휘청거려서 중심을 못 잡겠어요”이런 경험, 한 번쯤 있으셨죠?처음엔 단순 피로라고 넘기기 쉽지만이 증상이 반복된다면“몸의 균형

만성피로, 질문 있어요
3건환자분들이 남긴 온라인 상담 질문과 의료진 답변입니다.
이런 경우에는 미루지 말고 진료를 받으세요
아래 증상이 피로와 함께 있다면 다른 질환일 수 있습니다. 지체하지 말고 응급실이나 전문 진료를 먼저 찾으세요.
- 가슴 통증이나 숨이 찬 증상이 갑자기 생겼다: 119
- 이유 없이 체중이 빠르게 줄고 있다
- 열이 계속되거나 밤에 식은땀으로 옷이 젖는다
- 혈변이나 검은 변을 보거나, 얼굴이 창백하고 어지럽다
- 죽고 싶다는 생각이나 자해 생각이 든다: 자살예방 상담전화 109(24시간) 또는 가까운 응급실
참고문헌 5편
[1]Stadje R, Dornieden K, Baum E, Becker A, Biroga T, Bösner S, et al. The differential diagnosis of tiredness: a systematic review. BMC Fam Pract. 2016;17(1):147. doi:10.1186/s12875-016-0545-5. PMID: 27765009.
초록 (Abstract)
Background: Tiredness is one of the most frequent complaints in primary care. Although often self-limiting and frequently associated with psychosocial stress, patients but also their physicians are often uncertain regarding a serious cause and appropriate diagnostic work-up. We conducted a systematic review and meta-analysis of studies reporting on differential diagnosis of fatigue in primary care.
Methods: MEDLINE, EMBASE and conference abstracts were searched for primary care based studies of patients presenting with tiredness. Twenty-six studies were included. We report on anaemia, malignancy, serious organic disease, depression and the chronic fatigue syndrome (CFS) as causes of tiredness as presenting complaint.
Results: We found considerable heterogeneity of estimates which was reduced by limiting our analysis to high quality studies. Prevalences were as follows-anaemia: 2.8 % (CI (confidence interval) 1.6–4.8 %); malignancy: 0.6 % (CI 0.3–1.3 %); serious somatic disease: 4.3 % (CI 2.7–6.7 %); depression 18.5 % (CI 16.2–21.0 %). Pooling was not appropriate for CFS. In studies with control groups of patients without the symptom of tiredness, prevalence of somatic disease was identical to those complaining of tiredness. Depression, however, was more frequent among those with tiredness.
Conclusions: Serious somatic disease is rare in patients complaining of tiredness. Since prevalence is similar in patients without tiredness, the association may not be causal. Extensive investigations are only warranted in case of specific findings from the history or clinical examination. Instead, attention should focus on depression and psychosocial problems.
Electronic supplementary material: The online version of this article (doi:10.1186/s12875-016-0545-5) contains supplementary material, which is available to authorized users.
결과 (Results)
Search result and study selection: The electronic literature search was carried out in October 2010 and produced 3733 publications. 83 of them met our inclusion criteria. A few studies resulted in more than one publication so that we found 81 relevant studies overall. Forty-six studies dealt with the aetiology of tiredness. We excluded 20 studies in which patients were systematically asked about tiredness, the remaining 26 studies investigating tiredness as a reason for encounter or secondary complaint form the sample of our review. Further details of the selection process are given in a flow-chart (Fig. 1).Fig. 1Flow of search
Included studies: Most studies were conducted in Europe (n = 12). The number of included patients ranged from 22 to 10,279. Detailed information about the included studies is given in Table 1 and Additional file 2.Table 1Characteristics of the included studiesFirst author, yearCountrySample sizeSymptom definitionAnaemiaMalignancySevere somatic diseaseDepressionCFSFriedlander, 1962 USA71“Unbearable fatigue”Morrell, 1972 GB58New symptom that wasn’t brought up at a doctor’s visit during the last 12 months, main reason for encounterXMorrison, 1980 USA176Cause unknownXXXJerrett, 1981 GB300Tiredness as a central problem (“tiredness”, “need of tonic”, “run down”, etc.)XXXXSugarman, 1984 USA118Cause unknownXXXKnottnerus, 1986 NL174New SymptomXNelson, 1987 USA71At least 1 month, main reason for encounterKroenke, 1989 USA823-year incidence of the symptom of 1000 randomly selected patient filesValdini, 1989 USA22Since at least 1 year, cause unknownXXXKirk, 1990 USA71Since at least 1 month, important problemXCathebras, 1992 CDN93Through direct questioning (“Why did you come here today?”) or if the doctor indicated that tiredness was a reason for encounterXXXElnicki, 1992 USA52Since > 1 month, cause unknown, main reason for encounterXXXXGerber, 1992 USA88Tiredness as one of the chief complaintsXRidsdale, 1993 GB220“being knackered, lethargic, run down or tired all the time”, since at least 2 weeks, main reason for encounterXXXFuhrer, 1994 F287Since at least 2 weeksXHall, 1994 GB197Diagnosis of tiredness in the patient’s fileXMaeno, 2002 J157“General fatigue”, main reason for encounterXAndrea, 2003 NL322“Fatigue-related visite”XDarbishire, 2003 GB141Since at least 6 months, cause unknownXXGialamas, 2003 AUS342“Tiredness”, “fatigue”, “weariness”, “weakness”, “lethargy” or “malaise” in patient’s recordXXKenter, 2003 NL10.297Episodes of care with tiredness as the reason for encounterXXVital Durand, 2004 F120Since at least 6 months, cause unknownBelanger, 2005 CDN36“Fatigue” (no precise definition)Kenter, 2007 NL385Diagnosis “tiredness”XKoch, 2009 NL296New symptom, cause unknownXXNijrolder, 2009 NL571New symptom (no encounter due to tiredness in the last 6 months), main reason for encounterXXXXX
Quality of included studies: Nineteen of the included studies had a prospective design, 5 were retrospective analyses of clinical records and 2 were based on registries. In 15 studies consecutive recruitment was mentioned explicitly. The inclusion and exclusion criteria were well-defined in most of the studies (n = 24). Only 11 studies were conducted in more than one health care facility. The number of drop-outs and the reasons for withdrawal were specified in 12 studies. In 20 studies the diagnostic categories were well-defined. In 21 studies the reference standards to detect underlying illnesses were appropriate. Participating patients were subjected to the same reference standard in 12 studies. Exactly the same diagnostic investigations were applied to the patients in 8 studies. Six of the 26 studies had a control group of non-fatigued patients. Details are shown in Table 2.Table 2Methodical quality of the included studies+ YesWas the recruitment of patients prospective?Where all patients with the symptom included in the study?Are inclusion and exclusion criteria precisely defined?Was the study design multicentered?Were the number of drop-outs and the reasons for withdrawal specified?Were the diagnostic categories well-defined?Was the reference standard that was used appropriate?Was every patient subjected to the reference standard?Were the same diagnostic procedures applied to all patients?Was there an appropriate comparison group?− No? Unclear+/−Criteria fulfilled for part of the aetiologiesAndrea, 2003 +++−−?−−−+Belanger, 2005 ++++?++++−Cathebras, 1992 +++−−?+++/−+Darbishire, 2003 +?++?+++/−+/−−Elnicki, 1992 +++−−++++/−−Friedlander, 1962 +?−−−+−−−−Fuhrer, 1994 ++++?+++++Gerber, 1992 +++−+++++−Gialamas, 2003 −−++++++/−+/−−Hall, 1994 −−−−−++c??−Jerrett, 1981 +++−−++/−+/−+/−−Kenter, 2003 −++++++−−+Kenter, 2007 ++++?+++++Kirk, 1990 +++++?+++−Knottnerus, 1986 +?+−++++++Koch, 2009 +++++++++−Kroenke, 1989 −?+−+?+−−−Maeno, 2002 +++−+++++−Morrell, 1972 +++−+?+/−−−−Morrison, 1980 −?+−+++−−−Nelson, 1987 +?++−?−−−?Nijrolder, 2009 +?+++++−−−Ridsdale, 1993 +?++−+++/−+/−−Sugarman, 1984 −++−++++/−+/−−Valdini, 1989 +?+−−++++/−−Vital Durand, 2004 +++?−+++−−
Tiredness in primary care: underlying diseases: We present results for the following etiological categories: anaemia, malignancies, serious somatic diseases, depression and CFS (Fig. 2).Fig. 2Quantitative analysis of prevalence rates of anaemia, malignancies, severe somatic diseases and depression among patients presenting with fatigue in primary care of selected studies
Thirteen studies assessed the frequency of anaemia in the respective study population. The prevalence rates ranged from 0 to 6.9 %; see Fig. 3. Three studies used precisely defined diagnostic criteria and an appropriate diagnostic work-up. The pooled estimate within this group was 2.8 % (95 % CI: 1.6–4.8) (see Fig. 3).Fig. 3Forest plot, frequencies of anaemia and quantitative analysis
Knottnerus et al. reported the prevalence of anaemia in a control group and, interestingly, found no significant difference between tired patients and those consulting for other reasons. The test used a type 1 error of level alpha of 0.05 and had a power (1-ß) of 0.09 to find a difference of 0.5 mmol/l in the mean haemoglobin level.
Three studies reported the prevalence of malignancies among patients complaining of tiredness. The prevalence rate of malignancies in our quantitative synthesis was 0.6 % (CI 0.3–1.3 %) (see Fig. 2). Jerrett, who diagnosed a carcinoma of the lung in one patient, points out that the patient’s main complaints were cough and dyspnea. Tiredness was only an additional complaint.
Eleven studies analysed the frequency of serious somatic diseases (see Fig. 4). In this category we included anaemia, malignancies and other serious illnesses associated with tiredness for which treatments are available. We conducted a meta-analysis with 3 studies that had prospective study designs and used defined diagnostic standards. The prevalence rate of serious somatic diseases was 4.3 % (CI 2.7–6.7 %) (see Fig. 3).Fig. 4Forest plots, frequencies of severe somatic diseases and quantitative analysis
Diabetes, anaemia and hypothyroidism were most frequent. In the study of Cathebras et al. serious somatic illnesses did not occur more frequently among the fatigued than among the non-fatigued study population.
Depression was investigated in 14 studies (see Fig. 5). Six studies used standardized instruments (HADS (Hospital Anxiety and Depression Scale), SCL-90 (Symptom Check List), CES-D (Center for Epidemiological Studies Depression Scale) ). These latter studies found that up to 68.2 % of the fatigued study population scored positive. However, because of somatic and mental comorbidities these estimates may be too high. In the study of Cathebras et al. all recruited patients underwent a structured interview (DIS (Diagnostic Interview Schedule). Here about 17 % (CI 10.2–26.4 %) of the patients presenting with tiredness were classified as being depressive. Most studies relied on GPs diagnosing depression according to their routine.Fig. 5Forest plots, frequencies of depressions and quantitative analysis
We performed a quantitative synthesis of 6 of these studies. Current depression was identified in 18.5 % (CI 16.2–21.0 %) of the patients (see Fig. 2). Three studies, which were not included in the meta-analysis for methodological reasons, found a significantly higher prevalence of depression in fatigued compared to non-fatigued patients.
Three studies presented estimates of the frequency of CFS among fatigued primary care attenders. Two reported low rates of 1.9 % (CI 0.0–10.3 %) and 0.7 % (CI 0.2–1.8 %) (see Fig. 2). Darbishire et al. who used the CDC (Centers for Disease Control and Prevention) definition reported a high rate of 31.2 % (CI 23.7–39.5 %). They only included patients who had suffered from tiredness for at least 6 months and had not received a diagnosis associated with tiredness. Hence two important diagnostic criteria of CFS were met by all included patients, which explains the high prevalence. Given the small number of studies we did not pool results.
원문 발췌 · Stadje R, Dornieden K, Baum E, Becker A, Biroga T, Bösner S, Haasenritter J, Keunecke C, Viniol A, Donner-Banzhoff N, BMC Fam Pract 2016 · CC BY 4.0 라이선스에 따라 수정 없이 인용했습니다(본문 속 인용 번호는 생략).
[2]Lim EJ, Ahn YC, Jang ES, Lee SW, Lee SH, Son CG. Systematic review and meta-analysis of the prevalence of chronic fatigue syndrome/myalgic encephalomyelitis (CFS/ME). J Transl Med. 2020;18(1):100. doi:10.1186/s12967-020-02269-0. PMID: 32093722.
초록 (Abstract)
Background: Chronic fatigue syndrome/myalgic encephalomyelitis (CFS/ME) has been emerging as a significant health issue worldwide. This study aimed to systemically assess the prevalence of CFS/ME in various aspects of analyses for precise assessment.
Methods: We systematically searched prevalence of CFS/ME from public databases from 1980 to December 2018. Data were extracted according to 7 categories for analysis: study participants, gender and age of the participants, case definition, diagnostic method, publication year, and country of the study conducted. Prevalence data were collected and counted individually for studies adopted various case definitions. We analyzed and estimated prevalence rates in various angles: average prevalence, pooled prevalence and meta-analysis of all studies.
Results: A total of 1291 articles were initially identified, and 45 articles (46 studies, 56 prevalence data) were selected for this study. Total 1085,976 participants were enrolled from community-based survey (540,901) and primary care sites (545,075). The total average prevalence was 1.40 ± 1.57%, pooled prevalence 0.39%, and meta-analysis 0.68% [95% CI 0.48–0.97]. The prevalence rates were varied by enrolled participants (gender, study participants, and population group), case definitions and diagnostic methods. For example, in the meta-analysis; women (1.36% [95% CI 0.48–0.97]) vs. men (0.86% [95% CI 0.48–0.97]), community-based samples (0.76% [95% CI 0.53–1.10]) vs. primary care sites (0.63% [95% CI 0.37–1.10]), adults ≥ 18 years (0.65% [95% CI 0.43–0.99]) vs. children and adolescents < 18 years (0.55% [95% CI 0.22–1.35]), CDC-1994 (0.89% [95% CI 0.60–1.33]) vs. Holmes (0.17% [95% CI 0.06–0.49]), and interviews (1.14% [95% CI 0.76–1.72]) vs. physician diagnosis (0.09% [95% CI 0.05–0.13]), respectively.
Conclusions: This study comprehensively estimated the prevalence of CFS/ME; 0.89% according to the most commonly used case definition CDC-1994, with women approximately 1.5 to 2 folds higher than men in all categories. However, we observed the prevalence rates are widely varied particularly by case definitions and diagnostic methods. An objective diagnostic tool is urgently required for rigorous assessment of the prevalence of CFS/ME.
결과 (Results)
Characteristics of the included studies: From four major public databases, a total of 1291 articles were initially identified, and 45 articles finally met the inclusion criteria for this study. The first study of selected articles was reported in 1990, and the latest one was in 2018. Forty-six studies (one article contained two studies) were conducted in 13 countries (41 prospectively and 5 retrospectively). Four studies applied multiple case definitions (2 studies applied 4 case definitions, 2 studies applied 3 case definitions), providing a total of 56 prevalence data (Fig. 1). The total number of participants was 1085,976 from 30 community-based studies (33 data, n = 540,901) and 16 primary care studies (23 data, n = 545,075). Thirty-four studies (44 data) focused on the general population (n = 956,526, age ≥ 18 years), 7 focused on children and adolescents (n = 117,307, < 18 years), and 5 focused on a particular population (n = 12,143; nurses, 2; company employees, 1; livestock employees, 1; Gulf War veterans, 1). The average number of participants in each study was 23,608 ± 48,092 (± SD). Of the 46 studies, 21 studies (24 data) reported gender-related information (males, n = 62,070; females, n = 68,772) (Table 1).Table 1Characteristics of studies on the prevalence of CFS/ME (± SD)GroupCommunityPrimary careTotalNumber of articles included (%)30 (67)15 (33)45 (100)Number of studies includeda(%)30 (65)16 (35)46 (100)Prospective25 (54)16 (35)41 (89)Retrospective4 (9)1 (2)5 (11)Number of prevalence datab (%)33 (59)23 (41)56 (100)Total number of participants540,901545,0751085,976Mean N. of participants18,030 ± 38,09434,067 ± 61,32523,608 ± 48,092Total number of known sexc120,76510,077130,842 Male58,752331862,070 Female62,013675968,772 M:F ratio48:5225:7545:55Mean age of participantsd41.1 ± 11.338.0 ± 6.540.0 ± 9.9 Male41.1 ± 11.338.0 ± 6.839.9 ± 10.0 Female41.2 ± 11.438.1 ± 6.140.0 ± 9.8N. of (studies)/prevalence data by subgroup (N. of participants) Publication year 1990–20008(177,201)15(318,391)(18)/23(495,592) 2001–201019(86,512)4(9895)(20)/23(96,407) 2011–20186(277,188)4(216,789)(8)/10(493,977) Population group General population (≥ 18 years)24(489,961)20(466,565)(34)/44(956,526) Children/adolescents (< 18 years)6(43,671)1(73,636)(7)/7(117,307) Specific populatione3(7269)2(4874)(5)/5(12,143) Case definition (8 case definitions)23(339,192)11(298,739)34(637,931) CDC-1994 4(20,037)4(27,454)8(47,491) Holmes 2(116,520)2(2980)4(119,500) Australian 2(3215)2(2980)4(6195) Oxford 1(10,396)3(505,299)4(515,695) CCC ECD PVES NICE f N/Ag1(59,101)1(1874)2(60,975) Country (13 countries) Western27(516,617)17(473,009)(34)/44(989,626) Asian5(23,197)5(70,192)(10)/10(93,389) Othersh1(1087)1(1874)(2)/2(2961) Diagnostic method Interview (medical test −)19(111,943)3(68,848)(19)/22(180,791) Interview (medical test +)9(57,339)14(17,445)(18)/23(74,784) Physician diagnosis1(114,000)5(435,782)(4)/6(549,782) Medical records4(257,619)1(23,000)(5)/5(280,619)aThe number of studies is larger (n = 46) than the number of article as one article included two studiesbSome articles included multiple applications of case definitions; thus, the number is larger than the total number of studiescTwenty-one studies (24 prevalence data points) included information about participant sexdThe mean age of the participants whose sex was known (12 studies) was estimated using either the reported mean age for each sex or the mean age for both. Children and adolescents were excludedeSpecific groups included nurses, Gulf War veterans, livestock workers, company employees, etcfCCC, Canadian Consensus Criteria; ECD, epidemiological case definition; PVES, post viral exhaustion syndrome; and NICE, National Institute for Health and Care Excellence guideline 2007gTwo N/A cases had no verification of case definition or defined criteriahOther countries included India and Nigeria
A total of 8 case definitions were adopted in 46 studies (56 data); the most frequently used definitions were CDC-1994 (34 data) and Holmes (8 data). The majority of the studies (37 studies/45 data) used interview-based diagnoses with/without medical tests, and the remaining studies (9 studies/11 data) were based on a physicians’ diagnosis/determination and medical record reviews. The average age of all participants except children and adolescents, based on the mean of the means/median ages reported in the articles, was 40.0 ± 9.9 years (Table 1).
Overview of CFS/ME prevalence: The average prevalence of CFS/ME based on the 56 prevalence data reported was 1.40 ± 1.57% (95% CI: 0.98–1.82), and the pooled prevalence was 0.39% (5370 CFS/ME patients of 1387,787 participants) (Table 2). The meta-analysis yielded an estimate of 0.68% (95% CI: 0.48–0.97) with high heterogeneity I2 = 99.4% (Table 3, Fig. 2). For the general population (excluding data for children and adolescents and specific populations), the average prevalence was 1.45 ± 1.68% (95% CI: 1.01–1.89) and 0.38% (4724 CFS/ME patients of 1258,337 participants) and 0.65% (95% CI: 0.43–0.99) in the meta-analysis based on 44 prevalence data (Tables 2 and 3, and Fig. 3).Table 2Prevalence of CFS/ME by subgroup (± SD)GroupaMale (%)Female (%)Total (%, M/F)Total (%)(21 studies/24 data)(46 studies/56 data)Average prevalence of all studies1.11 ± 1.052.24 ± 2.591.67 ± 2.061.40 ± 1.57Pooled prevalence of all studies (Total N. of CFS/N. of participantsb)0.74 (451/61,069)1.92 (1308/68,124)1.37 (1778/129,780)0.39 (5370/1387,787)Pooled prevalence of the general population (N. of adult CFS/N. of adult participants)0.75 (451/60,432)1.92 (1304/67,790)1.38 (1774/128,809)0.38 (4724/1258,337)Mean age of CFS patients (12 studies)39.3 ± 7.839.1 ± 7.640.4 ± 7.740.4 ± 7.7Prevalence by subgroup (N. of studies that reported sex) Study participants Community (16)1.03 ± 1.132.31 ± 2.881.67 ± 2.281.56 ± 1.80 Pooled prevalence (N. of CFS/N. of participantsb)0.70 (404/57,751)1.94 (1190/61,365)1.34 (1594/119,116)0.73 (4014/548,461) Primary care (5)1.39 ± 0.561.96 ± 0.741.68 ± 0.721.16 ± 1.13 Pooled prevalence (N. of CFS/N. of participantsb)1.42 (47/3318)1.75 (118/6759)1.64 (165/10,077)0.21 (1739/839,326) Publication year 1990–2000 (9)0.62 ± 0.581.26 ± 1.420.94 ± 1.130.96 ± 0.91 2001–2010 (10)1.35 ± 1.182.99 ± 3.112.17 ± 2.492.08 ± 2.01 2011–2018 (2)1.75 ± 0.831.78 ± 0.711.76 ± 0.770.84 ± 0.86 Population group General population (≥ 18 years) (19)1.39 ± 1.052.83 ± 2.612.11 ± 2.071.45 ± 1.68 Children/adolescents (< 18 years) (0)–––0.89 ± 0.82 Specific populationc(1)0.120.060.09 ± 0.031.62 ± 1.17 Case definition (8 case definitions) CDC-1994 (16)1.24 ± 1.042.61 ± 2.751.93 ± 2.191.46 ± 1.34 Holmes (4)0.07 ± 0.050.14 ± 0.150.11 ± 0.120.34 ± 0.40 Australian (1)2.655.233.94 ± 1.292.52 ± 2.99 Oxford (2)1.23 ± 0.641.76 ± 1.221.51 ± 1.001.73 ± 1.35 CCC ECD PVES NICE d(0)–––0.53 ± 0.77 Country (13 countries) Western (12)1.14 ± 0.972.40 ± 2.861.77 ± 2.221.32 ± 1.45 Asian (8)1.23 ± 2.922.06 ± 1.851.65 ± 1.641.51 ± 1.74 Otherse(1)0.110.500.31 ± 0.202.65 ± 2.37 Diagnostic method Interview (medical test -) (9)1.70 ± 1.214.32 ± 3.243.01 ± 2.632.03 ± 2.13 Interview (medical test +) (10)0.86 ± 0.701.23 ± 0.931.05 ± 0.841.17 ± 0.77 Physician diagnosis (0)–––0.10 ± 0.05 Medical records (1)2.572.492.53 ± 0.061.25 ± 1.00aThe prevalence by sex was estimated from studies that reported both the number of participants and the number with CFSbParticipant number was applied to individual prevalence data for the studies with multiple case definitionscSpecific groups included nurses, Gulf War veterans, livestock workers, company employees, etcdCCC, Canadian Consensus Criteria; ECD, epidemiological case definition; PVES, post viral exhaustion syndrome; and NICE, National Institute for Health and Care Excellence guideline 2007; two studies with no verification of case definition and defined criteria were excludedeOther countries included India and NigeriaTable 3Meta-analysis results for the prevalence of CFS/MEGroupN. of dataaRandom effects model (%)Heterogeneity (P < 0.01, P = 0%)Prevalence95% CIQT2I2 (%)Total560.68[0.48; 0.97]8602.901.719999.4Sex Male240.86[0.58; 1.27]279.890.666691.8 Female241.36[0.91; 2.02]822.640.800397.2 Total481.04[0.76; 1.41]1481.760.947196.8Study participants Community330.76[0.53; 1.10]3286.471.036399.0 Primary care230.63[0.37; 1.10]2732.101.774599.2Population group General population (≥ 18 years) Male230.89[0.60; 1.32]276.230.660792.0 Female231.36[0.91; 2.04]818.300.800997.3 Total440.65[0.43; 0.99]7717.651.851899.4 Children/adolescents (< 18 years)70.55[0.22; 1.35]538.131.431998.9 Specific population51.31[0.61; 2.78]80.540.665795.0Case definition CDC-1994 340.89[0.60; 1.33]3871.641.369199.1 Holmes 80.17[0.06; 0.49]101.721.889093.1 Australian 40.79[0.05; 12.55]1002.437.886099.7 Oxford 41.41[0.68; 2.93]35.170.446891.5 CCC ECD PVES NICE b40.17[0.04; 0.83]1200.672.586499.8Diagnostic method Interview (medical test −)221.14[0.76; 1.72]1675.910.826998.7 Interview(medical test +)230.95[0.69; 1.31]365.720.520894.0 Physician diagnosis60.09[0.05; 0.13]200.490.295297.5 Medical records50.52[0.16; 1.71]1197.281.836099.7Refer to supplementary Additional file: Figs. 1, 2, 3, 4, 5, 6, 7aTotal number of prevalence data pointsbCCC, Canadian Consensus Criteria; ECD, epidemiological case definition; PVES, post viral exhaustion syndrome; and NICE, National Institute for Health and Care Excellence guideline 2007; two studies with no verification of case definition and defined criteria were excludedFig. 2Meta-analysis of the total CFS/ME prevalance. CFS chronic fatigue syndrome. ME myalgic encephalitisFig. 3Meta-analysis of the CFS/ME prevalence in adults (≥ 18 years). CFS chronic fatigue syndrome, ME myalgic encephalitis
Regarding gender-related differences, 24 data (from 21 studies that included information about gender) indicated an approximately 2.0-fold preponderance of females of 2.24 ± 2.59% vs. 1.11 ± 1.05% for the total population and 2.83 vs. 1.39% for the general population; the prevalence was 1.5-fold higher according to the meta-analysis, 1.36 vs. 0.89% (Table 2 and 3, Fig. 4).Fig. 4Meta-analysis of the CFS/ME prevalence in males a, females b. CFS chronic fatigue syndrome, ME myalgic encephalitis
Prevalence by study participants: When we analyzed the CFS/ME prevalence according to study participants (community-based sample vs. primary care sample), the 30 community studies (33 data) showed a prevalence of 1.56 ± 1.80% (95% CI: 1.08–2.04), and the 16 primary care studies (23 data) showed a prevalence of 1.16 ± 1.13% (95% CI: 0.86–1.46). A higher prevalence in community studies was also observed in the pooled prevalence results of 0.73% (4014 CFS/ME patients out of 548,461 participants) vs. 0.21% (1739 out of 839,326) and in the meta-analysis findings of 0.76% (95% CI: 0.53–1.10) vs. 0.63% (95% CI: 0.37–1.10), respectively (Table 2, 3, and Additional file 2). From the results of 21 studies (24 data) with known gender-related data, the prevalence of female preponderates in both community (2.31% vs. 1.03%) and primary care settings (1.96 vs. 1.39%) (Table 2).
Prevalence by study population group: The study population was divided into 3 groups: general population (n = 956,526, ≥ 18 years), children and adolescents (n = 117,307, < 18 years), and specific populations (n = 12,143, e.g., nurses, Gulf War veterans) (Table 1). The prevalence in the general population (1.45%) and in specific populations (1.62%) were higher than that in children and adolescents (0.89%) (Table 2). The meta-analysis indicated prevalence of 0.65% (95% CI: 0.43–0.99) in the general population, 1.31% (95% CI: 0.61–2.78) in specific populations and 0.55% (95% CI: 0.22–1.35) in children and adolescents (Table 3, Fig. 3, and Additional file 3). In the general population, a female predominance was shown in both the averaged (2.83 ± 2.61 vs. 1.39 ± 1.05%), and the meta-analysis (1.36%, 95% CI: 0.91–2.04 vs. 0.89, 95% CI: 0.60–1.32) (Table 2, 3 and Fig. 4).
Prevalence by case definitions: Eight case definitions were adopted for 44 studies (54 data); 2 studies used unknown case definitions. The total prevalence was notably different according to case definition:, the prevalence was the highest with Australian (2.52 ± 2.99%), then in descending order, Oxford (1.73 ± 1.35%), CDC-1994 (1.46 ± 1.34%) and Holmes definitions (0.34 ± 0.40%), but in the meta-analysis, the orders changed to Oxford (1.41%, 95% CI: 0.68–2.93), CDC-1994 (0.89%, 95% CI: 0.60–1.33), Australian (0.79%, 95% CI: 0.05–12.55) and Holmes (0.17%, 95% CI: 0.06–0.49) (Table 2, 3 and Additional file 4, 5).
Prevalence by diagnostic method: In this study, the diagnostic methods could be classified into four groups, and the prevalence data differed significantly among them (P < 0.05), as follows: interview without a medical test (survey and/or questionnaire, 19 studies, averaged prevalence 2.03 ± 2.13%), interview with a medical test (18 studies, 1.17 ± 0.77%), review of medical records (5 studies, 1.25 ± 1.00%) and physician diagnosis (4 studies, 0.10 ± 0.05%) (Table 1, 2).
The meta-analysis also showed different prevalence, as follows: interviews without medical tests (1.14%, 95% CI: 0.76–1.72), interviews with medical tests (0.95% 95% CI: 0.69–1.31), medical record review (0.52% 95% CI: 0.16–1.71), and physician diagnoses (0.09%, 95% CI: 0.05–0.13) (Table 3, and Additional file 6, 7).
Prevalence by country and publication year: The majority of the studies were conducted in Western countries (34 studies/44 prevalence data from 8 countries, 989,626 participants), followed by Asian countries (10 studies/10 data, 3 countries, 93,389), and others (2 studies/2 data, 2 countries, 2961). The total prevalence reported for Western and Asian populations were comparable (1.32 ± 1.45% vs. 1.51 ± 1.74%) (Tables 1, 2 and Additional file 1). The majority (38 of 46) of the studies were published between 1990 and 2010. Of those studies, 10 (of 18) studies were for primary care population conducted in 1990s, whereas 16 (of 20) for community in 2000s. More studies on community-based were conducted in 2000s than 1990s (Table 1). The total prevalence in 2000s (2.08 ± 2.01) was approximately twofold higher than 1990s (0.96 ± 0.91) (Table 2).
원문 발췌 · Lim EJ, Ahn YC, Jang ES, Lee SW, Lee SH, Son CG, J Transl Med 2020 · CC BY 4.0 라이선스에 따라 수정 없이 인용했습니다(본문 속 인용 번호는 생략).
[3]Nelson MJ, Bahl JS, Buckley JD, Thomson RL, Davison K. Evidence of altered cardiac autonomic regulation in myalgic encephalomyelitis/chronic fatigue syndrome: A systematic review and meta-analysis. Medicine (Baltimore). 2019;98(43):e17600. doi:10.1097/md.0000000000017600. PMID: 31651868.
초록 (Abstract)
Background: Myalgic Encephalomyelitis/Chronic Fatigue Syndrome (ME/CFS) is a complex condition with no reliable diagnostic biomarkers. Studies have shown evidence of autonomic dysfunction in patients with ME/CFS, but results have been equivocal. Heart rate (HR) parameters can reflect changes in autonomic function in healthy individuals; however, this has not been thoroughly evaluated in ME/CFS.
Methods: A systematic database search for case-control literature was performed. Meta-analysis was performed to determine differences in HR parameters between ME/CFS patients and controls.
Results: Sixty-four articles were included in the systematic review. HR parameters assessed in ME/CFS patients and controls were grouped into ten categories: resting HR (RHR), maximal HR (HRmax), HR during submaximal exercise, HR response to head-up tilt testing (HRtilt), resting HR variability (HRVrest), HR variability during head-up tilt testing (HRVtilt), orthostatic HR response (HROR), HR during mental task(s) (HRmentaltask), daily average HR (HRdailyaverage), and HR recovery (HRR) Meta-analysis revealed RHR (MD ± 95% CI = 4.14 ± 1.38, P <.001), HRtilt (SMD ± 95% CI = 0.92 ± 0.24, P <.001), HROR (0.50 ± 0.27, P <.001), and the ratio of low frequency power to high frequency power of HRVrest (0.39 ± 0.22, P <.001) were higher in ME/CFS patients compared to controls, while HRmax (MD ± 95% CI = –13.81 ± 4.15, P <.001), HR at anaerobic threshold (SMD ± 95% CI = –0.44 ± 0.30, P = 0.005) and the high frequency portion of HRVrest (–0.34 ± 0.22, P =.002) were lower in ME/CFS patients.
Conclusions: The differences in HR parameters identified by the meta-analysis indicate that ME/CFS patients have altered autonomic cardiac regulation when compared to healthy controls. These alterations in HR parameters may be symptomatic of the condition.
결과 (Results)
The literature search initially identified 412 unique records. The 317 studies did not meet the inclusion criteria and were excluded. Of the remaining 95 studies, data were inadequately reported in 31. None of the authors provided missing data upon request, resulting in a total of 64 studies for inclusion. A summary of the search outcomes, including the number of studies excluded at various phases is shown in Figure 1.
Critical appraisal of included studies: Inter-rater agreement for critical appraisal was high (κ = 0.75). Critical appraisal revealed that the majority of included studies were of moderate or good quality. Seventeen articles were found to be of ‘moderate’ quality (score between 50% and 59%), while 30 studies were found to be of ‘good’ quality (score between 60% and 69%). Four articles were found to be of ‘low’ quality (score below 50%), with each article scoring 45%. Thirteen articles were found to be ‘high’ quality (score over 70%) The most common questions which resulted in a response of ‘No’ during critical appraisal were “Were confounding factors identified?” (performed in 20% of studies), and “Were strategies to deal with confounding factors stated?” (23%). Few studies (30%) reported on the specific length of exposure to the condition so it was difficult to assess the question “Was the exposure period of interest long enough to be meaningful?”. However, as this review only included studies which diagnosed ME/CFS through accepted criteria, and all of these criteria require the presence of the condition for at least 6 months, it is likely that all included studies reported on a meaningful exposure. That said, studies which did not explicitly report on the length of exposure to the condition were graded as “not available” for that question. Generally, patients and controls within the included studies were comparable, and both the exposure to the condition and all relevant HR parameters were assessed in a standard, valid and reliable manner. Appropriate statistical analysis were used in the vast majority of studies, however statistical analyses were unclear in 7 studies.
Participants: In total, the 64 included studies reported on 2286 ME/CFS patients and 1758 healthy controls who had HR parameters assessed. Of these studies, 14 recruited exclusively female participants, and 50 studies recruited a mixed gender sample. Overall, 79% of ME/CFS patients were female (n = 1803), compared to 73% for controls (n = 1283), while 1 study did not specify the gender of participants.
Diagnostic criteria: The 1994 CDC criteria were the most commonly used diagnostic criteria (47 studies), followed by the 1988 CDC criteria (8 studies), the Oxford criteria (5 studies), and the ICC (5 studies). Four studies employed the CCC, in each case in addition to another form of criteria (CDC alone, CDC+ICC).
Study outcomes: Overall, HR parameters extracted from the included studies were sorted into 10 categories, and included studies for each parameter are presented in Table 1 – resting HR (RHR), maximal HR (HRmax) HR during submaximal exercise, heart rate during HUTT (HRtilt), Orthostatic HR response (HROR), resting HRV (HRVrest), HRV during HUTT (HRVtilt), HR during mental task (HRmentaltask), daily average HR (HRdailyaverage), and HRR
Resting heart rate: The most commonly assessed HR parameter was (RHR), which was assessed in 43 studies (patients n = 1766, controls n = 1291). Studies varied regarding the body position used to assess RHR, with 16 studies (patients n = 1059, controls n = 548) using a seated/reclined position (RHRseated), and 26 (patients n = 707, controls n = 743) using a supine position (RHRsupine). Meta-analysis revealed ME/CFS patients had a RHR that was ∼4 beats/minute faster compared to controls (MD ± 95% CI = 4.14 ± 1.30, P <.001; Fig. 2), but with significant heterogeneity between studies (P <.001, I2 = 62%). Subgroup analysis revealed a similar difference between ME/CFS patients and controls for RHRsupine (4.02 ± 2.11, P <.001), and RHRseated (4.53 ± 2.40, P <.001), with significant heterogeneity amongst studies evaluating RHRsupine (P <.001, I2 = 73%).
Maximal heart rate: HRmax was reported in 20 studies (patients n = 989, controls n = 568), which used 2 different exercise modalities (cycling, 13 studies; and treadmill walking, 7 studies) to elicit a maximal response. Five studies (patients n = 111, controls n = 123) – four of which employed a cycling protocol – based the attainment of a maximal response on accepted criteria and assessed true HRmax, while the remaining 15 studies (patients n = 878, controls n = 445) only reported the highest HR achieved during testing, and is likely to represent symptom limited peak HR (HRpeak), rather than a true HRmax.
Meta-analysis showed HRmax values were found to be lower for ME/CFS patients compared to controls (–13.81 ± 4.14, P <.001, Fig. 3), but were also affected by significant heterogeneity (P <.001, I2 = 78%). Subgroup analysis showed the difference between ME/CFS patients and controls was considerable in studies which measured symptom limited HRpeak (–16.62 ± 4.68, P <.001), with significant heterogeneity between studies (P <.001, I2 = 74%). Comparatively, in studies which assessed true HRmax the difference between ME/CFS patients and controls was smaller, albeit still significant (–5.81 ± 3.34, P <.001), with no heterogeneity present (P =.88, I2 = 0%).
Heart rate during submaximal exercise: HR during submaximal exercise was reported by 14 studies (patients n = 837, controls n = 496), with 10 studies using cycling exercise, and 4 studies using treadmill walking exercise (Table 1 ). Six studies (patients n = 539, controls n = 313) reported HR at a particular submaximal exercise ‘threshold’ (anaerobic threshold [AT], ventilatory threshold [VT], or lactate threshold [LT]), which were representative of the transition from predominately aerobic to predominately anaerobic energy systems (HRthreshold). In addition, nine studies reported a steady state HR response (HRsteadystate) at a given submaximal workload, with Blackwood et al reporting HR's at both a light absolute workload, and at a workload designed to elicit 85% of maximal HR. Seven (patients n = 244, controls n = 129) studies reported HRsteadystate during workloads that were likely below submaximal exercise threshold (AT, VT or LT), while 3 studies (patients n = 54, controls n = 54) reported a HRsteadystate that was likely to be at or above submaximal exercise threshold (AT, VT, or LT).
Given the variations in the ways exercise HR was recorded and reported, with different thresholds being assessed in addition to varying exercise intensities at, above or below those thresholds, meta-analysis was performed separately for each HR parameter assessed during submaximal exercise. Analysis of HRthreshold revealed a moderate difference, with HRs being lower in ME/CFS patients compared to healthy controls (SMD ± 95% CI = –0.44 ± 0.31, P =.005), albeit with significant heterogeneity (P =.04, I2 = 56%; Fig. 4). No difference was found between ME/CFS patients and controls for HRsteadystate for workloads that were either likely below (0.09 ± 0.30, P =.59) or likely above submaximal exercise threshold (AT, VT, or LT) (0.30 ± 0.69, P =.40).
Heart rate during head-up tilt testing: Nine studies (patients n = 285, controls n = 257) reported HR in response to HUTT (HRtilt) (Table 1 ). Eight studies (patients n = 208, controls n = 188) reported an absolute HR value during HUTT (peak HR, end HR, etc) and 3 studies (patients n = 77, controls n = 69) reported the ΔHR in response to HUTT. Meta-analysis revealed HRtilt was higher in ME/CFS patients than it was in controls (SMD ± 95% CI = 0.92 ± 0.24, P <.001; Fig. 5). Subgroup analysis revealed that HRtilt was increased in ME/CFS patients compared to controls, regardless of whether data were reported as the peak HR during a short (1.23 ± 0.40, P <.001) or long (0.86 ± 0.36, P <.001) duration HUTT, or if data were reported as the ΔHR during HUTT (0.74 ± 0.44, P =.001).
Orthostatic heart rate response: The orthostatic HR response (HROR) was reported in 6 studies (patients n = 197, controls n = 131) (Table 1 ). Five studies reported HROR in response to standing up after a period of supine rest, while 1 study reported the effect of standing up following sitting. Meta-analysis showed HROR was higher for ME/CFS patients compared to controls (SMD ± 95% CI = 0.50 ± 0.27, P <.001; Fig. 6). Subgroup analysis revealed there was a moderate difference when HROR was reported as the ΔHR upon moving from lying/sitting to standing, with ME/CFS patients having a higher ΔHR than controls (0.86 ± 0.46, P <.001), with a similar finding, albeit of a smaller magnitude, also found for the peak HR obtained upon standing (0.34 ± 0.27, P =.01).
Resting heart rate variability: Measures of resting HRV (HRVrest) were reported in 13 studies (patients n = 294, controls n = 270) (Table 1 ). Seven studies recorded HRVrest in a supine position, while 3 recorded HRVrest while seated/reclined. Two studies recorded HRVrest during overnight sleep. Frequency domain HRVrest measures were used in 12 studies, with 1 study reporting only time domain analyses, and 2 studies reporting both frequency and time domain analyses.
Parameters of HRVrest from included studies were meta-analysed separately. ME/CFS patients had a higher ratio between low frequency and high frequency power (LF/HF) (SMD ± 95% CI = 0.20 ± 0.25, P =.11) than controls, and a lower high frequency power (HFP) (–0.34 ± 0.22, P =.002) and root mean of the sum of squares of beat to beat deviations (RMSSD) (–0.37 ± 0.32, P =.02) (Fig. 7). No differences were found for low frequency power (LFP) (0.39 ± 0.22, P <.001), Vagal Power (–1.86 ± 2.08, P =.08), or sleeping LF/HF ratio (–0.52 ± 2.48, P =.68), with significant heterogeneity for Vagal Power (P =.006, I2 = 87%), and sleeping LF/HF (P <.001, I2 = 96%).
Heart rate variability during head-up tilt testing: Two studies (patients n = 40, controls n = 24) reported HRV during HUTT (HRVtilt) (Table 1 ). Both studies reported exclusively frequency domain parameters, with each reporting on LFP, HFP, and LF/HF ratio. Meta-analysis found no difference between ME/CFS patients and controls for LFP (SMD ± 95% CI = 0.44 ± 0.87, P =.32; Fig. 8), HF power (0.29 ± 0.51, P =.27), or LF/HF ratio (0.35 ± 0.51, P =.18).
Heart rate during mental task(s): Five studies (patients n = 107, controls n = 116) reported the HR response to a mental task (HRmentaltask) (Table 1 ). Subgroup analysis revealed no significant effect for HRmentaltask when reported as the average HR during the tasks in 4 studies 6451, (SMD ± 95% CI = 0.25 ± 0.32, P =.57) (Fig. 9). One study reported HRmentaltask as the ΔHR during task, again with no significant difference between ME/CFS and controls (-0.29 ± 0.45, P =.21).
Daily average heart rate: Daily average HR (HRdailyaverage) was reported in 2 studies (patients n = 80, controls n = 162) (Table 1 ). Both studies used the same measurement techniques and reported data in the same way – HR data were measured through ECG monitoring, and both studies reported the average HR over 24 hours. Meta-analysis revealed no difference between the ME/CFS patients and controls (SMD ± 95% CI = 0.11 ± 0.27, P =.45; Fig. 10), with no heterogeneity between the studies (P =.56, I2 = 0%).
Post-exertional heart rate recovery: HRR was reported in only 2 articles (patients n = 108, controls n = 72), both of which used similar methods to elicit and record HRR (Table 1 ). Meta-analysis found no difference in HRR between ME/CFS patients and controls (MD ± 95% CI = –11.78 ± 13.72, P =.09; Fig. 11), with results affected by significant statistical heterogeneity (P =.003, I2 = 89%).
원문 발췌 · Nelson MJ, Bahl JS, Buckley JD, Thomson RL, Davison K, Medicine (Baltimore) 2019 · CC BY 4.0 라이선스에 따라 수정 없이 인용했습니다(본문 속 인용 번호는 생략).
[4]Wang T, Xu C, Pan K, Xiong H. Acupuncture and moxibustion for chronic fatigue syndrome in traditional Chinese medicine: a systematic review and meta-analysis. BMC Complement Altern Med. 2017;17(1):163. doi:10.1186/s12906-017-1647-x. PMID: 28335756.
초록 (Abstract)
Background: As the etiology of chronic fatigue syndrome (CFS) is unclear and the treatment is still a big issue. There exists a wide range of literature about acupuncture and moxibustion (AM) for CFS in traditional Chinese medicine (TCM). But there are certain doubts as well in the effectiveness of its treatment due to the lack of a comprehensive and evidence-based medical proof to dispel the misgivings. Current study evaluated systematically the effectiveness of acupuncture and moxibustion treatments on CFS, and clarified the difference among them and Chinese herbal medicine, western medicine and sham-acupuncture.
Methods: We comprehensively reviewed literature including PubMed, EMBASE, Cochrane library, CBM (Chinese Biomedical Literature Database) and CNKI (China National Knowledge Infrastructure) up to May 2016, for RCT clinical research on CFS treated by acupuncture and moxibustion. Traditional direct meta-analysis was adopted to analyze the difference between AM and other treatments. Analysis was performed based on the treatment in experiment and control groups. Network meta-analysis was adopted to make comprehensive comparisons between any two kinds of treatments. The primary outcome was total effective rate, while relative risks (RR) and 95% confidence intervals (CI) were used as the final pooled statistics.
Results: A total of 31 randomized controlled trials (RCTs) were enrolled in analyses. In traditional direct meta-analysis, we found that in comparison to Chinese herbal medicine, CbAM (combined acupuncture and moxibustion, which meant two or more types of acupuncture and moxibustion were adopted) had a higher total effective rate (RR (95% CI), 1.17 (1.09 ~ 1.25)). Compared with Chinese herbal medicine, western medicine and sham-acupuncture, SAM (single acupuncture or single moxibustion) had a higher total effective rate, with RR (95% CI) of 1.22 (1.14 ~ 1.30), 1.51 (1.31–1.74), 5.90 (3.64–9.56). In addition, compared with SAM, CbAM had a higher total effective rate (RR (95% CI), 1.23 (1.12 ~ 1.36)). In network meta-analyses, similar results were recorded. Subsequently, we ranked all treatments from high to low effective rate and the order was CbAM, SAM, Chinese herbal medicine, western medicine and sham-acupuncture.
Conclusions: In the treatment of CFS, CbAM and SAM may have better effect than other treatments. However, the included trials have relatively poor quality, hence high quality studies are needed to confirm our finding.
Electronic supplementary material: The online version of this article (doi:10.1186/s12906-017-1647-x) contains supplementary material, which is available to authorized users.
결과 (Results)
Searching result: A total of 1345 potentially relevant citations were identified, 47 of which were degree research thesis. 157 duplicate papers were removed firstly, and 1000 papers were excluded after scanning their titles and abstracts. After screening the full texts of the included articles, 158 studies were excluded for the following reasons: no relevant data (n = 35), inapposite treatments set (n = 73), patients with tuberculosis (n = 1), duplicate reports (n = 12), not RCT (n = 3), unclear diagnose criteria (n = 7), inapposite criteria of invalid evaluation (n = 24), inappropriate western medicine (n = 3). However, one additional article was identified during screening. Finally, 31 studies (including1 three-arm study ) were included for further analysis (Fig. 1).Fig. 1Flow chart of study selection
Studies description: We included 31studies (Additional file 1: Table S1), all of these were conducted in China and published in Chinese. The sample size of these studies ranged from 30 to 200, and the total number of patients was 2255. The age of patients ranged from 18 to 78, and the duration of treatment was from 10 to 90 days. All studies adopted the diagnosis criteria of American CDC (1988 or 1994 edition). As acupuncture and moxibustion had many forms, such as auricular acupuncture, electroacupuncture, which were acupuncture, we treated them all as acupuncturein the present study. Therefore, the control treatments were Chinese herbal medicine, western medicine, sham-acupuncture and SAM (single acupuncture or single moxibustion).
All the included studies were divided into five groups based on the intervention in experiment and control groups: (1) CbAM (combined acupuncture and moxibustion, which meant two or more types of acupuncture and moxibustion were adopted) versus Chinese herbal medicine (n = 8); (2) SAM versus Chinese herbal medicine (n = 12); (3) SAM versus western medicine (n = 4); (4) SAM versus sham-acupuncture (or placebo treatment) (n = 4); (5) CbAM versus SAM (n = 5).
Quality of the included studies: After assessing the quality of studies based on the basis of Cochrane risk of bias, we revealed that 17 trials reported random sequence generation, 2 studies provided information on allocation concealment, 4 trials described blinding of participants (single or double),1 trial described blinding of outcome assessment,3 trials had unclear bias of complete data and 5 trials had unclear other biases (defined as baseline data comparability). Selective reporting bias was unclear (Fig. 2).Fig. 2The Cochrane risk of bias
Synthesis of results / CbAM versus Chinese herbal medicine: Eight trials, 515 participants (259 in experiment group and 256 in control) were included in this group. The pooled results of the 8 trials that compared CbAM with Chinese herbal medicine were of RR (95% CI), 1.17 (1.09-1.25), indicating that CbAM was more effective than Chinese herbal medicine (Fig. 3). There were no heterogeneity (I 2 = 0%, p = 0.83).Fig. 3Forest plot of CbAM versus Chinese herbal medicine
SAM versus Chinese herbal medicine: Twelve trials, 951 participants (478 in experiment group and 473 in control) were included in this group. With only not important heterogeneity existed (I 2 = 29.8%, p = 0.15), the pooled result of the 8 trials was performed with fixed effect model and the result (RR (95% CI), 1.22 (1.14–1.30) showed that SAM had better effects than Chinese herbal medicine (Fig. 4). There was no publication bias after egger’s test (p = 0.82).Fig. 4Forest plot of SAM versus Chinese herbal medicine
SAM versus western medicine: A total of 4 trials (286 participants, 142 in experiment group and 144 in control) were adopted in this group. The pooled results indicated that SAM had a better effect than western medicine (RR (95% CI), 1.51 (1.31–1.74)), with no heterogeneity among the studies (I 2 = 0%, p = 0.59) (Fig. 5).Fig. 5Forest plot of SAM versus western medicine
SAM versus placebo treatment (sham-acupuncture): Four trials (246 participants, 124 in experiment group and 122 in control) were conducted to compare SAM with sham-acupuncture. The pooled result indicated that SAM was much more effective than sham-acupuncture (RR (95% CI), 5.90 (3.64–9.56)), with no heterogeneity (I 2 = 0%, p = 0.45) (Fig. 6).Fig. 6Forest plot of SAM versus placebo treatment (sham-acupuncture)
CbAM versus SAM: A total of 5 trials, 356 participants (178 in experiment group and 178 in control) were involved in this group. The pooled results revealed that CbAM was more effective than SAM (RR (95% CI), 1.23 (1.12–1.36)) (Fig. 7). The statistic I 2 for homogeneity of RR showed there was no heterogeneity among the studies (I 2 = 13.1%, p = 0.33).Fig. 7Forest plot of CbAM versus SAM
Sensitivity analyses were performed in all traditional meta-analysis. No small sample effect existed after removing any single trial. Random effect model was also adopted and the results were similar to the fixed random effect, showing stable results (Figs. 3, 4, 5, 6 and 7).
Network meta-analysis: The results of network meta-analysis were similar with the traditional meta-analysis (Table 1), showed that all treatments were more effective than sham-acupuncture, and the comprehensive rank (from high to low effective rate) was CbAM, SAM, Chinese herbal medicine, western medicine and sham-acupuncture (Figs. 8 and 9)Table 1Comparison of network meta-analysis and traditional meta-analysisCbAMSAMChinese medicineWestern medicinePlacebo (Sham-acupuncture)TreatmentT-metaa N-metab T-metaa N-metab T-metaa N-metab T-metaa N-metab T-metaa N-metab CbAM––1.23 (1.12–1.36)1.10 (1.04–1.17)1.17 (1.09–1.25)1.23 (1.15–1.32)–1.68 (1.29–1.69)–5.84 (1.19–12.21)SAM–0.91 (0.85–0.96)––1.22 (1.14–1.30)1.12 (1.03–1.21)1.51 (1.31–1.74)1.53 (1.17–2.43)5.90 (3.64–9.56)5.31 (1.74–11.07)Chinese medicine–0.81 (0.77–0.87)–0.89 (0.83–0.97)–––1.20 (1.10–1.50)–4.00 (2.50–6.90)Western medicine–0.62 (0.37–0.77)–0.68 (0.41–0.85)–0.76 (0.46–0.96)–––3.20 (1.90–5.50)placebo (sham-acupuncture)–0.21 (0.08–0.53)–0.24 (0.09–0.58)–0.26 (0.10–0.65)–0.37 (0.12–0.99)–– astands for traditional meta-analysis bstands for network meta-analysis Fig. 8Network of involved treatments. CbAM, combined acupuncture and moxibustion; SAM, single acupuncture or single moxibustion; CHM, Chinese herbal medicine; WM, western medicine; PT, placebo treatment (sham-acupuncture) Fig. 9Comprehensive comparison of all treatments. Left, probabilities of all treatments in each rank; right, absolute risk (effective rate) of all treatments
Adverse events: Of the conducted trials, adverse events happened in four studies. In total, there was fainting during acupuncture (6 cases), feeling of acid bilges on the back (6 cases),subcutaneous hematoma (1 case), burn during moxibustion (1 case). No serious adverse events happened.
Acupuncture point: The acupoints were chosen with two ways, constant point and constant point plus points based on the basis of symptoms. After analysis of points adopted in trial, we found Walking Three Miles (ST36), Spleen Locus (BL20), and Liver Locus (BL18) were the three points most commonly used (Additional file 2: Figure S1).
원문 발췌 · Wang T, Xu C, Pan K, Xiong H, BMC Complement Altern Med 2017 · CC BY 4.0 라이선스에 따라 수정 없이 인용했습니다(본문 속 인용 번호는 생략).
[5]Kim HG, Cho JH, Yoo SR, Lee JS, Han JM, Lee NH, et al. Antifatigue effects of Panax ginseng C.A. Meyer: a randomised, double-blind, placebo-controlled trial. PLoS One. 2013;8(4):e61271. doi:10.1371/journal.pone.0061271. PMID: 23613825.
요약 특발성 만성피로 환자 90명에게 인삼 추출물 또는 위약을 4주간 투여한 무작위 대조 연구입니다. 전체 피로 점수는 위약과 통계적으로 유의한 차이가 없었고, 정신적 피로 점수는 인삼 군이 위약보다 더 좋아졌습니다.원문은 출판사 저작권 자료로, 위 링크에서 확인하실 수 있습니다.