

화장실에 앉아 한참을 힘주어도 소식이 없습니다. 배는 빵빵하고, 변비약을 먹어야만 겨우 나오는 날이 늘어납니다. 며칠에 한 번이 일상이 되었다면 변비 치료가 필요한 상태입니다.
변비 한눈에 보기
- 변비는 배변이 일주일에 3회 미만이거나, 변이 딱딱해 힘을 많이 주고 잔변감이 남는 상태가 이어지는 것입니다.
- 성인 7명 중 1명이 겪고 여성은 2배 이상 많으며, 나이가 들수록 늘어납니다.
- 장의 움직임은 자율신경이 조절하므로 식사뿐 아니라 스트레스, 수면, 생활 리듬을 함께 다스려야 합니다.
- 치료후기 15건
- 의료진 칼럼 1편
- 온라인 상담 3건
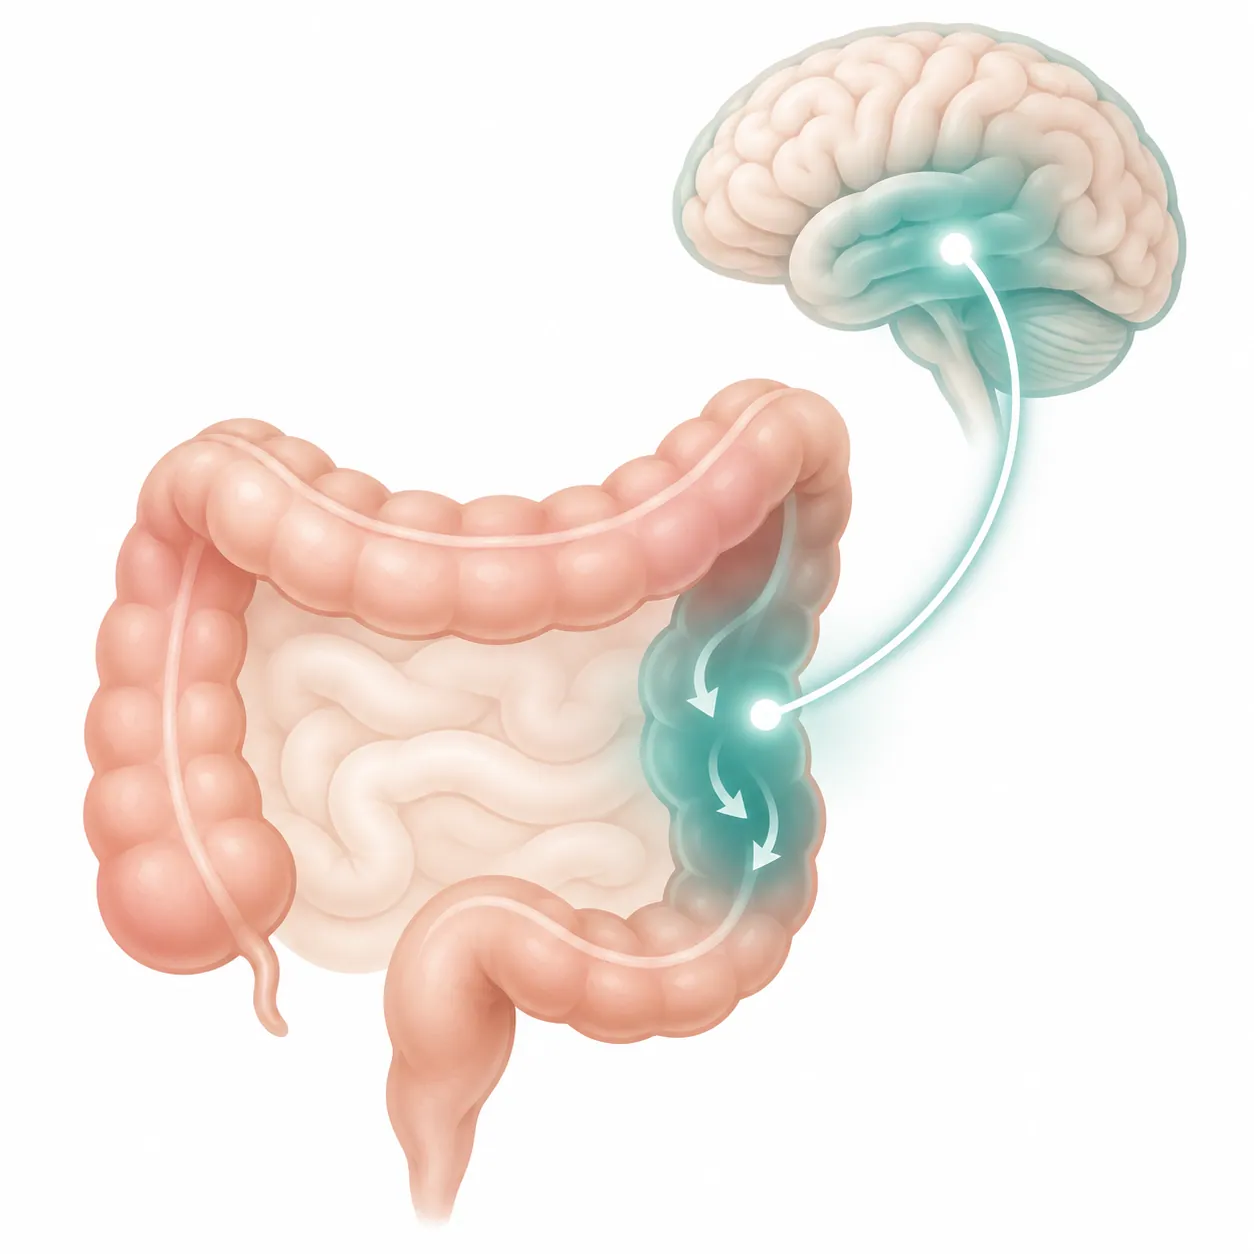
이런 증상이 있나요?

- 일주일에 3번도 변을 보지 못한다
- 변이 딱딱하고 토끼똥처럼 조각나서 나온다
- 오래 힘을 줘야 겨우 나온다
- 변을 보고도 남은 것 같아 개운하지 않다
- 배가 빵빵하고 가스가 찬다
- 변비약이나 관장 없이는 변을 보기 어렵다
- 여행을 가거나 스트레스를 받으면 더 심해진다
변비는 증상과 변의 모양(브리스톨 대변 척도)으로 진단합니다. 다른 질병이 의심될 때는 대장내시경으로 확인하고, 변비약에 반응하지 않으면 대장의 움직임과 항문 기능을 살피는 검사를 하기도 합니다[1].
변비는 왜 생기나요?
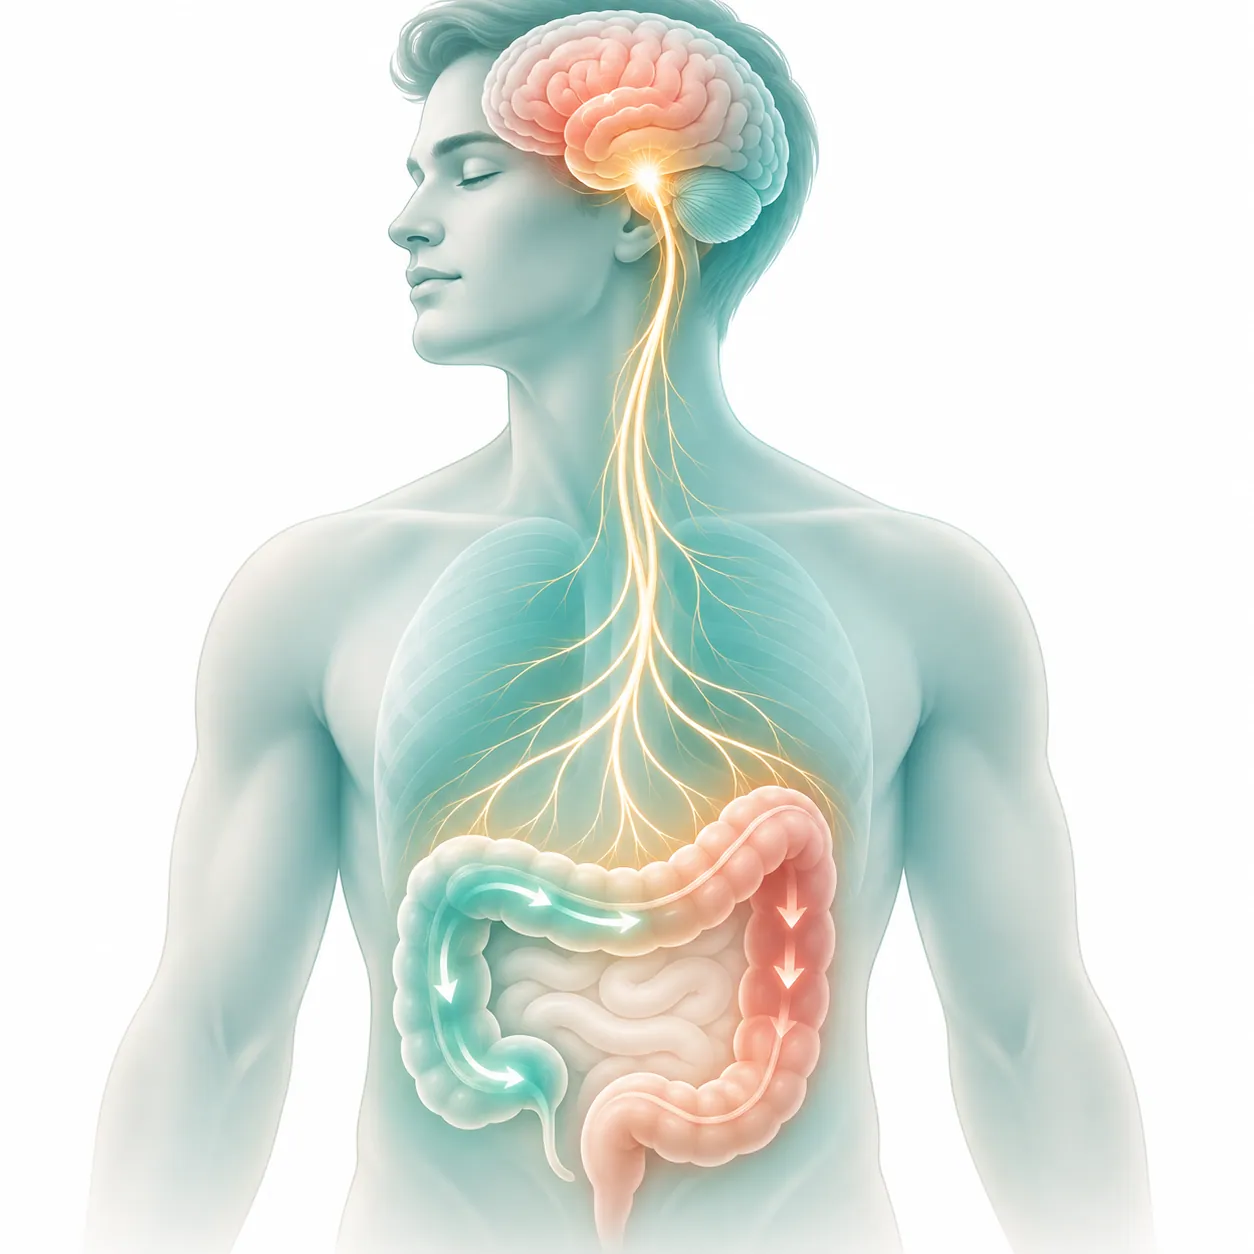
- 식이섬유와 수분이 부족한 식사
- 적은 활동량, 오래 앉아 있는 생활
- 변의가 와도 참는 습관
- 스트레스, 불규칙한 수면과 식사
- 철분제나 일부 진통제, 항우울제 같은 약
- 갑상선 저하증, 당뇨 같은 몸의 병
이 중에서도 '스트레스와 긴장'은 만성변비에서 꼭 살펴봐야 할 부분입니다. 장은 뇌와 자율신경으로 연결되어 있습니다. 긴장하면 장의 움직임이 줄고, 몸이 편안할 때 활발해집니다. 그래서 스트레스를 받거나 여행을 가면 변이 막힙니다. 마음과의 고리도 뚜렷합니다. 변비가 있는 사람의 20.9%가 주요우울증을 겪어, 변비가 없는 사람(7.9%)보다 훨씬 많았습니다[4]. 변비는 과민성 장 증후군이 있는 사람에게서도 7.98배 많았습니다[2].
변비의 표준 치료
변비의 기본 치료는 식이섬유와 수분, 활동량을 늘리는 것입니다. 식이섬유는 하루 10g 넘게 4주 이상 먹었을 때 효과가 좋았고, 66%가 호전되어 대조군(41%)보다 많았습니다[5]. 그래도 좋아지지 않으면 변비약을 씁니다[1].
변비약은 변을 내보내는 데 도움이 되지만, 장이 움직이지 않는 이유까지 해결하지는 못합니다. 스트레스와 수면, 소화 상태가 그대로라면 약을 끊을 때마다 변비가 되풀이됩니다. 한의학 치료는 장이 스스로 움직이는 바탕을 다스려 변비를 해결합니다.
연구도 쌓여 있습니다. 심한 만성 변비 환자 1,075명을 대상으로 한 연구에서 전침 치료는 주당 자발적 완전 배변 횟수를 1.76회 늘려, 가짜 전침(0.87회)의 두 배였습니다[6]. 한약 마자인환은 291명을 대상으로 한 연구에서 8주째 완전 반응률이 68%로 위약(33%)보다 높았고, 변비약 센나(57.7%)와는 뚜렷한 차이가 없었습니다[7].
해움한의원은 이렇게 치료합니다

해움한의원은 변을 밀어내는 데 그치지 않고, 장이 스스로 움직이도록 몸의 상태를 찾아 함께 치료합니다.
1단계. 변비의 유형과 위험 신호를 가립니다
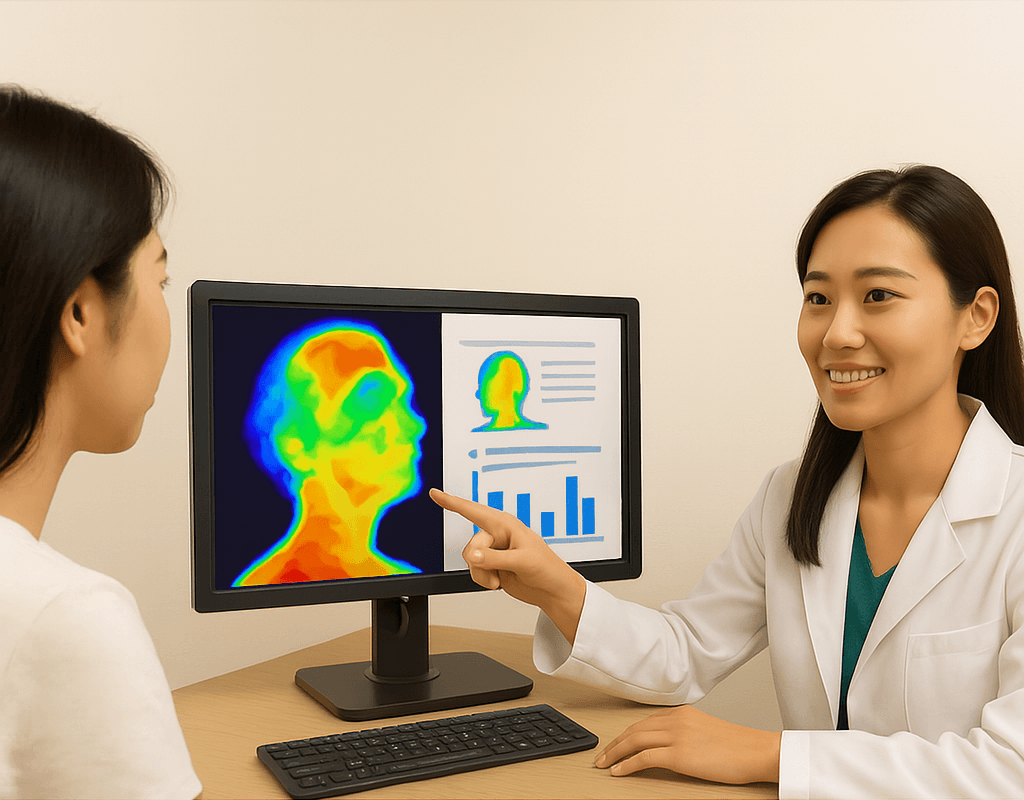
배변 횟수와 변의 모양, 복용 중인 약, 식사와 수면을 자세히 살펴봅니다. 위험 신호가 있으면 대장내시경 검사를 먼저 안내해 드립니다. 심박변이도 검사로 자율신경의 긴장 상태를 확인합니다.
2단계. 장의 움직임을 돕습니다
침과 약침, 뜸으로 굳은 배와 허리의 긴장을 풀고, 장이 움직이도록 자율신경의 균형을 돕습니다.
3단계. 유형에 맞춰 바탕을 다스립니다
체질과 상태에 맞춰 한약을 짓습니다. 변비약을 줄여 가는 과정도 함께합니다.
4만 건의 처방 사례가 말해주는, 한방 맞춤 치료의 힘


변비 치료후기 총 15건
환자분들이 남긴 치료후기입니다. 본문은 로그인 후 보실 수 있습니다.
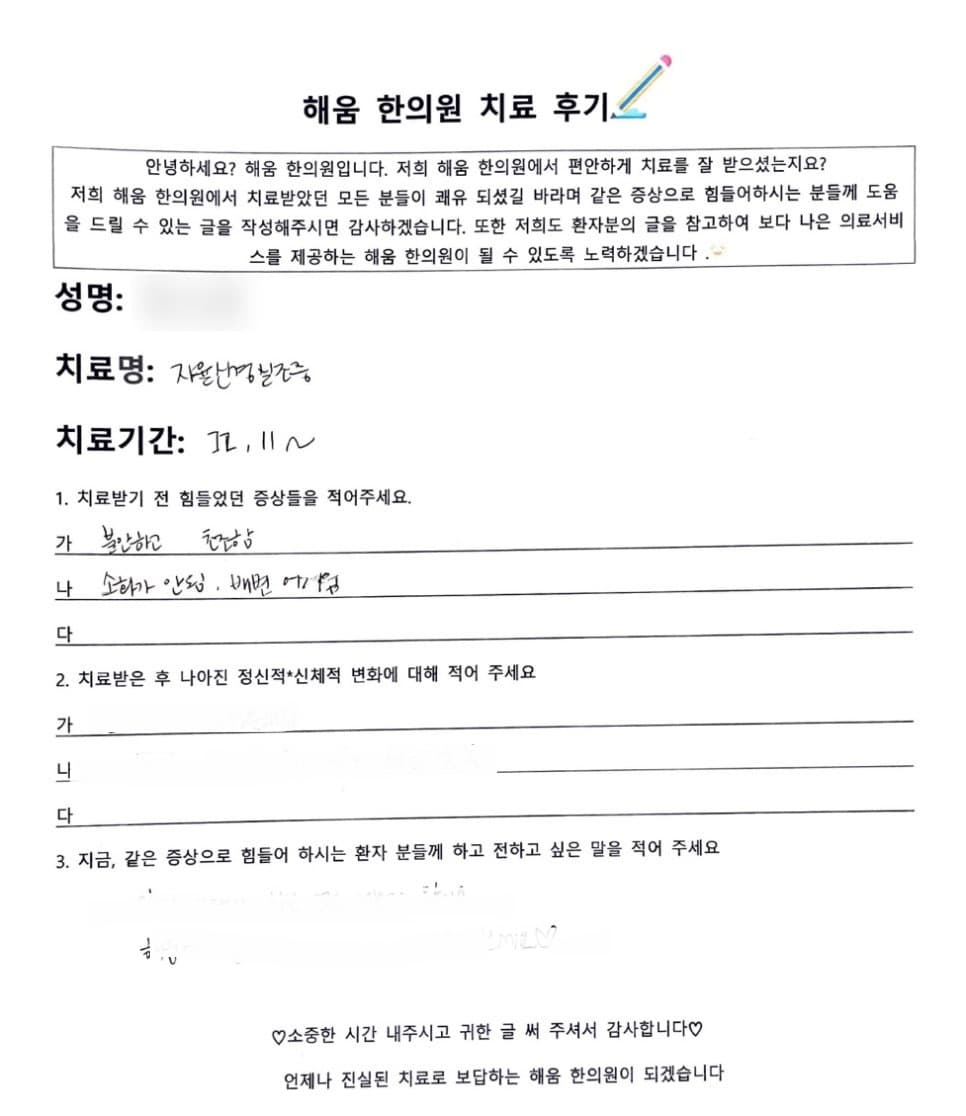
심한 변비 배아픔에 직빵, 소화불량 불안 불면 3개월
2024. 05. 02.

생리전증후군인가요? 진통제를 하루 8알씩.. 심각한 생리통 편두통 변비 한약 먹고 좋아진 사례
2023. 12. 13.

1일1똥이 소원이에요 귀여우신 남자 환자분의 변비 치료기
2022. 04. 08.

애기때부터 시작한 만성변비와 여드름 치료사례, 장건강이 피부건강에 얼마나 중요하냐면요
2021. 10. 28.
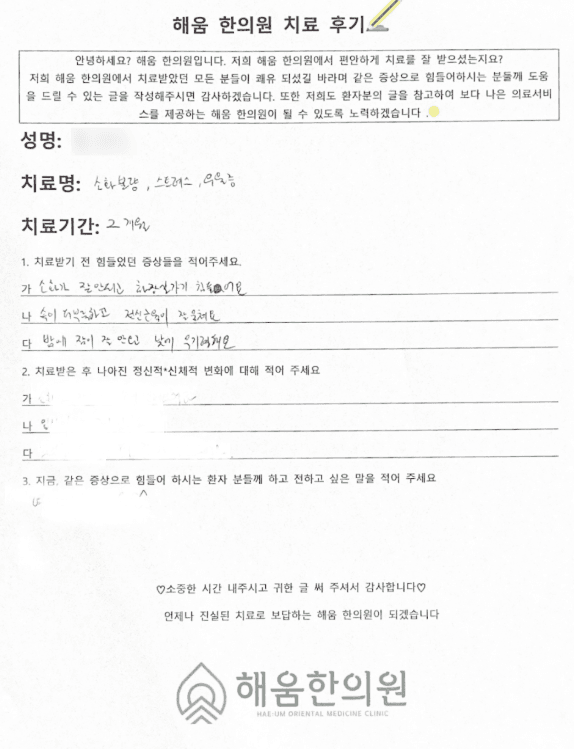
변비로 항상 더부룩했던 환자, 변비 좋아지면서 불면, 우울증도 같이 좋아진 사례
2021. 09. 04.
 관련 후기
명치답답 소화불량, 담적 증상 같은데 원인이 없대요. 정신과 문제인 걸까요?
2026. 01. 31.
다른 증상으로 내원하신 분들의 후기 중 ‘변비’가 증상으로 함께 언급된 기록
- 브레인포그, 어지럼증, 인지 기능 저하, 젊은이 치매2024. 07. 20.
- 코로나 후유증 가슴두근거림, 불면2024. 06. 27.
- 이유모를 공황장애 한약으로 치료한 후기2024. 06. 07.
- 치료 안 돼서 고생하던 과민대장증후군2024. 06. 06.
- 불면증두통, 호흡곤란, 다이어트와 함께2024. 05. 24.
- 저혈압과 함께 어지러움이 심한 학생2024. 05. 22.
- 어깨 수술 후 악화된 이석증 어지러움 한약 치료 후기2024. 05. 21.
- 코로나 후유증으로 구토 미식거림 두통 어지러움 연하장애로 고생하신 노인 환자분2023. 01. 03.
- 배가 계속 아프다고 하는 4살 아가, 내시경 관장 위장약 다 시도해도 소용없던 복통 다한증과 함께 좋아진 사례2021. 10. 29.
변비, 누가 진료하나요?
담당 의료진
대표원장 박재은

“병이 아니라 그 뒤의 사람을 봅니다”
경희대학교 한의과대학에서 석사·박사 과정을 마쳤습니다. 심리상담사 1급 자격과 4만 건 이상의 한약 처방 경험을 바탕으로 진료합니다.
의료진 소개 더보기변비, 자주 묻는 질문
며칠에 한 번 보면 변비인가요?
변비약을 계속 먹어도 되나요?
식이섬유를 먹었는데 오히려 배가 더 빵빵해요.
변비약과 한약을 같이 먹어도 되나요?
치료 기간은 얼마나 걸리나요?
생활에서 어떻게 관리해야 하나요?
해움한의원에서 변비를 진료하나요?
변비로 내원하려면 어떻게 하나요?
변비, 질문 있어요
3건환자분들이 남긴 온라인 상담 질문과 의료진 답변입니다.
이런 경우에는 미루지 말고 진료를 받으세요
아래 증상이 변비와 함께 있다면 장폐색이나 대장 질환일 수 있습니다. 지체하지 말고 응급실이나 소화기 진료를 먼저 찾으세요.
- 심한 복통과 구토가 있고 방귀도 나오지 않는다: 119
- 혈변을 보거나 변이 검게 나온다
- 이유 없이 체중이 줄고 있다
- 50세 이후 변비가 새로 생겼거나 배변 습관이 갑자기 달라졌다
- 대장암 가족력이 있는데 대장내시경을 받은 적이 없다
참고문헌 7편
[1]Cho YS, Lee YJ, Shin JE, Jung HK, Park SY, Kang SJ, et al. 2022 Seoul Consensus on Clinical Practice Guidelines for Functional Constipation. J Neurogastroenterol Motil. 2023;29(3):271-305. doi:10.5056/jnm23066. PMID: 37417257.
요약 우리나라 기능성 변비 진료지침입니다. 변비는 배변 횟수 감소, 딱딱한 변, 잔변감, 과도한 힘주기, 항문이 막힌 느낌 등으로 나타납니다. 진단에는 브리스톨 대변 척도, 대장내시경, 직장 수지 검사가 도움이 되고, 생리 기능 검사는 완하제에 반응하지 않는 환자 등에게 권합니다.원문은 출판사 저작권 자료로, 위 링크에서 확인하실 수 있습니다.
[2]Suares NC, Ford AC. Prevalence of, and risk factors for, chronic idiopathic constipation in the community: systematic review and meta-analysis. Am J Gastroenterol. 2011;106(9):1582-91; quiz 1581, 1592. doi:10.1038/ajg.2011.164. PMID: 21606976.
요약 26만여 명을 다룬 45개 연구의 메타분석입니다. 만성 변비 유병률은 14%였고, 여성이 2.22배 많았으며, 나이가 들수록 늘었습니다. 과민성 장 증후군이 있는 사람에게서 7.98배 많았습니다.원문은 출판사 저작권 자료로, 위 링크에서 확인하실 수 있습니다.
[3]Wald A, Scarpignato C, Mueller-Lissner S, Kamm MA, Hinkel U, Helfrich I, et al. A multinational survey of prevalence and patterns of laxative use among adults with self-defined constipation. Aliment Pharmacol Ther. 2008;28(7):917-930. doi:10.1111/j.1365-2036.2008.03806.x. PMID: 18644012.
요약 우리나라를 포함한 7개국 조사입니다. 변비가 있는 사람 가운데 16%(한국)에서 40%(미국)가 변비약을 썼고, 나이가 많고 증상이 잦을수록 많이 썼습니다.원문은 출판사 저작권 자료로, 위 링크에서 확인하실 수 있습니다.
[4]Wang P, Shen X, Wang Y, Jia X. Association between constipation and major depression in adult Americans: evidence from NHANES 2005-2010. Front Psychiatry. 2023;14:1152435. doi:10.3389/fpsyt.2023.1152435. PMID: 37654986.
초록 (Abstract)
Objective: Current studies on the association between constipation and depression is still insufficient. In this study, we investigated the detailed association between constipation and major depression among American adults.
Methods: In this cross-sectional study, 12,352 adults aged 20 and older were selected from the National Health and Nutrition Examination Survey 2005–2010 for the sample. Constipation was defined as fewer than three defecation frequencies per week. For the assessment of major depression, the validated Patient Health Questionnaire-9 was used. Adjusted odds ratios (ORs) were calculated using multivariate logistic regression models. A subgroup analysis was carried out to ensure that the results were stable.
Results: Of the 12,352 participants, 430 reported constipation, with a prevalence of 3.5%. Depression was reported in 1030 cases, indicating a prevalence rate of 8.3%. Patients with constipation were significantly more likely to have major depression (20.9%) than those without it (7.9%, p < 0.001). After adjusting for age, sex, race/ethnicity, marital status, education level, body mass index, vigorous physical activity, alcohol consumption, smoking status, poverty income ratio, diabetes, selective serotonin reuptake inhibitor use, liver disease, heart disease, pulmonary disease, hypertension, arthritis, cancer, dietary fiber intake, moisture intake, total fat intake, carbohydrates intake, and protein intake, constipation is significantly associated with major depression (OR: 2.20, 95%CI: 1.68–2.87, p < 0.001). Subgroup analyses by age, sex, dietary intake, risk behaviors, and common complications showed no statistically significant interactions (p > 0.05).
Conclusion: In conclusion, this study showed that constipation were significantly associated with depression. When treating patients with constipation, it is necessary for clinicians to screen and evaluate depression, and provide timely and effective intervention for patients with depression to avoid further deterioration of the condition.
결과 (Results)
Baseline characteristics: In Table 1, we compared the characteristics of participants in the constipated and normal groups. Among these participants, 430 reported constipation, with a prevalence of 3.5%. Patients with constipation had a higher incidence of being younger, female, White, divorced, separated or widowed, never married, under/normal weight, smokers, with a lower education level, and PIR. Constipated individuals consumed less fiber, fat, protein, carbohydrates, and water in their diets. Constipation was associated with a greater likelihood of heart disease and pulmonary disease among patients with comorbidities. 1,030 reported depression, with a prevalence of 8.3%. Patients with constipation were significantly more likely to have major depression (20.9%) than those without it (7.9%, p < 0.001).
In Table 2, we compared the characteristics of the participants in the depressed and non-depressed groups. Patients with major depression had a higher incidence of being younger, female, black, hispanic, divorced, separated or widowed, never married, obese, smokers, SSRI use, with a lower education level, PIR, and percentage of vigorous physical activity practicing. Patients with major depression consumed less fiber, fat, protein, carbohydrates, and water in their diets. Among patients with comorbidities, major depression was more likely to be associated with diabetes, liver disease, heart disease, pulmonary disease, hypertension, and arthritis. Patients with major depression were significantly more likely to have constipation (8.7%) than those without it (3.0%, p < 0.001).
Association between constipation and major depression: Based on univariate logistic regression analysis, race and ethnicity, sex, age, marital status, education level, PIR, BMI, smoking status, dietary intake, vigorous physical activity, SSRI use, and comorbidities (except cancer) were significantly related to major depression (all p < 0.05) (Table 3). In Table 4, the logistic regression results for the association between constipation and major depression are presented. The unadjusted model (Model I) showed an increased risk of major depression related to constipation (OR: 3.09, 95%CI: 2.43–3.94, p < 0.001). After controlling for sex and age (Model II), constipation and major depression were still associated (OR: 2.60, 95%CI: 2.03–3.32, p < 0.001). After adjusting for covariates in Model II and race/ethnicity, marital status, education level, PIR, BMI, vigorous physical activity, smoking status, SSRI use and alcohol consumption (Model III), constipation was still significantly positively associated with major depression (OR: 2.42, 95%CI: 1.86–3.14, p < 0.001). After controlling for covariates in Model III and diabetes, hypertension, arthritis, heart disease, pulmonary disease, liver disease, and cancer (Model IV), the results did not change significantly (OR: 2.29, 95%CI: 1.76–2.99, p < 0.001). Even after further adjusting for covariates in Model IV and dietary fiber, moisture, total fat, carbohydrate, and protein intake (Model V), constipation and major depression remained significantly associated (OR: 2.20, 95%CI: 1.68–2.87, p < 0.001).
A subgroup analysis of the data is presented in Figure 2 and Supplementary Figure 1. Subgroup analyses by age, sex, dietary intake, risk behaviors, SSRI use, and common complications showed no statistically significant interactions (p > 0.05). We found that the association between constipation and depression was relatively stable in every subgroup.
원문 발췌 · Wang P, Shen X, Wang Y, Jia X, Front Psychiatry 2023 · CC BY 4.0 라이선스에 따라 수정 없이 인용했습니다(본문 속 인용 번호는 생략).
[5]van der Schoot A, Drysdale C, Whelan K, Dimidi E. The Effect of Fiber Supplementation on Chronic Constipation in Adults: An Updated Systematic Review and Meta-Analysis of Randomized Controlled Trials. Am J Clin Nutr. 2022;116(4):953-969. doi:10.1093/ajcn/nqac184. PMID: 35816465.
초록 (Abstract)
Background: Chronic constipation is a prevalent disorder that remains challenging to treat. Studies suggest increasing fiber intake may improve symptoms, although recommendations on the fiber type, dose, and treatment duration are unclear.
Objectives: We investigated the effects of fiber supplementation on stool output, gut transit time, symptoms, and quality of life in adults with chronic constipation via a systematic review and meta-analysis of randomized controlled trials (RCTs).
Methods: Studies were identified using electronic databases, backward citation, and hand searches of abstracts. RCTs reporting administration of fiber supplementation in adults with chronic constipation were included. Risks of bias (RoB) was assessed with the Cochrane RoB 2.0 tool. Results were synthesized using risk ratios (RRs), mean differences, or standardized mean differences (SMDs) and 95% CIs using a random-effects model.
Results: Sixteen RCTs with 1251 participants were included. Overall, 311 of 473 (66%) participants responded to fiber treatment and 134 of 329 (41%) responded to control treatment [RR: 1.48 (95% CI: 1.17, 1.88; P = 0.001); I2 = 57% (P = 0.007)], with psyllium and pectin having significant effects. A higher response to treatment was apparent in fiber groups compared to control groups irrespective of the treatment duration, but only with higher fiber doses (>10 g/d). Fiber increased stool frequency [SMD: 0.72 (95% CI: 0.36, 1.08; P = 0.0001); I2 = 86% (P < 0.00001)]; psyllium and pectin had significant effects, and improvement was apparent only with higher fiber doses and greater treatment durations (≥4 weeks). Fiber improved stool consistency (SMD: 0.32; 95% CI: 0.18, 0.46; P < 0.0001), particularly with higher fiber doses. Flatulence was higher in fiber groups compared to control groups(SMD: 0.80; 95% CI: 0.47, 1.13; P < 0.00001).
Conclusions: Fiber supplementation is effective at improving constipation. Particularly, psyllium, doses >10 g/d and treatment durations of at least 4 weeks appear optimal, though caution is needed when interpreting the results due to considerable heterogeneity. These findings provide promising evidence on the optimal type and regime of fiber supplementation, which could be used to standardize recommendations to patients. The protocol for this review is registered at PROSPERO as CRD42020191404.
결과 (Results)
A total of 7356 nonduplicated records were identified, of which 93 were deemed to be potentially eligible (Figure 1). Of these, 77 records were excluded (Supplemental Table 1). One completed but unpublished trial (NCT01847950) was confirmed to be eligible after contact with the principal investigator; however, the data could not be shared due to a confidentiality agreement. In total, 16 RCTs fulfilled the criteria for inclusion in the review, involving 1251 participants with chronic constipation. Table 2 displays the characteristics of the included studies. Twelve studies were in English, 2 were in Spanish, 1 was in Korean, and 1 was in Chinese. There were 14 parallel RCTs and 2 crossover RCTs. For 1 crossover study, data from the first period only were extracted due to an inadequate washout period. There was variability in the fiber type (e.g., psyllium, polydextrose), dose (4 to 40 g/d), and treatment duration (2 to 8 weeks) studied. Authors of all studies were contacted for further information. Of these, 7 replied and 1 provided data for inclusion in the analyses.
Outcomes: The outcomes of the meta-analysis are reported in Table 3. Forest plots for subgroup analyses on fiber type, prebiotic status, doses, and treatment durations for each outcome are found in Supplemental Figures 1–22.
Response to treatment: Response to treatment, measured as symptomatic improvement, was reported as dichotomous data in 9 studies including 802 participants. Overall, 311 of 473 (66%) participants responded to fiber treatment and 134 of 329 (41%) responded to control treatment (RR: 1.48; 95% CI: 1.17, 1.88; P = 0.001), with substantial heterogeneity between studies (I2 = 57%; P = 0.007). Subgroup analyses showed significantly greater responses to treatment in the 3 trials of psyllium supplementation, with no significant heterogeneity [RR: 1.82 (95% CI: 1.51, 2.20; P < 0.00001); I2 = 0% (P = 0.98)] and in 1 trial of pectin supplementation (RR: 3.71; 95% CI: 1.83, 7.56; P = 0.0003) (Figure 2). Nonprebiotics increased response to treatment [RR: 1.46 (95% CI: 1.08, 1.97; P = 0.01); I2 = 69% (P = 0.002)], while prebiotics and mixtures of prebiotics and nonprebiotics did not; however, no significant subgroup differences were detected (P = 0.97). A significant effect was shown for high fiber doses (>10 g/d) [RR: 1.72 (95% CI: 1.35, 2.18; P < 0.0001); I2 = 41% (P = 0.09)], but not low fiber doses (≤10 g/d), with a statistically significant subgroup effect (P = 0.005); however, only a low number of studies contributed data to the low-dose subgroup. All treatment durations (less than or greater than 4 weeks) were effective at increasing response to treatment (Supplemental Figure 1).
Stool frequency: Stool frequency was measured in 15 studies; however, 1 study did not report data in a form that could be included in the meta-analysis, and these data were not obtained on request. Fourteen studies including 1040 participants were included in the meta-analysis. Stool frequency was reported in various units, such as bowel movements/week and days between bowel movements. Fiber significantly increased stool frequency compared to control (SMD: 0.72; 95% CI: 0.36, 1.08; P = 0.0001); however, considerable heterogeneity was detected (I2 = 86%; P < 0.00001). Subgroup analyses showed that psyllium significantly increased stool frequency [SMD: 1.13 (95% CI: 0.39, 1.88; P = 0.003); I2 = 67% (P = 0.05)], as did pectin and wheat bran. However, polydextrose, inulin-type fructans, and galacto-oligosaccharides (GOS) did not impact stool frequency (Figure 3). Prebiotics and nonprebiotics were effective at increasing stool frequency when administered individually but not as mixtures; however, no significant subgroup differences were detected (P = 0.73). High fiber doses (>10 g/d) significantly increased stool frequency [SMD: 0.93 (95% CI: 0.49, 1.38; P < 0.0001); I2 = 86% (P < 0.00001)], but low fiber doses (≤10 g/d) did not, with a statistically significant subgroup effect (P = 0.06). Greater treatment durations (≥4 weeks) significantly increased stool frequency [SMD: 1.13 (95% CI: 0.50, 1.76; P = 0.0001); I2 = 89% (P < 0.00001)], but shorter durations (<4 weeks) did not, with a statistically significant subgroup effect (P = 0.03) (Supplemental Figure 2). Heterogeneity remained high between studies within each subgroup. No significant funnel plot asymmetry was detected (Supplemental Figure 23).
A sensitivity analysis was conducted to include studies that measured and reported stool frequency using the same methods and units (bowel movements/week), and a MD was calculated. In 12 studies including 966 participants, fiber significantly increased stool frequency by +1.19 bowel movements/week (95% CI: 0.59, 1.78 bowel movements/week; P < 0.0001) compared to control; however, heterogeneity remained considerable (I2 = 80%; P < 0.00001) (Supplemental Figure 3). Psyllium significantly increased stool frequency by +3.08 bowel movements/week [95% CI: 0.61, 5.54 bowel movements/week; P = 0.01; I2 = 90% (P < 0.0001)] and GOS significantly increased stool frequency by +0.71 bowel movements/week [95% CI: 0.07, 1.34 bowel movements/week; P = 0.03; I2 = 68% (P = 0.04)]. High fiber doses (>10 g/d) increased stool frequency [MD: +1.60 bowel movements/week (95% CI: 0.71, 2.48 bowel movements/week; P = 0.0004); I2 = 85% (P < 0.00001)], but low fiber doses (≤10 g/d) did not, with a significant subgroup effect (P = 0.07). Greater treatment durations (≥4 weeks) increased stool frequency [MD: +1.33 bowel movements/week (95% CI: 0.62, 2.03 bowel movements/week; P = 0.0002); I2 = 81% (P < 0.00001)], but shorter durations (<4 weeks) did not; however, no significant subgroup differences were detected (P = 0.59). Heterogeneity remained high between studies within each subgroup (Supplemental Figure 3).
Stool consistency: Stool consistency was measured in 11 studies; however, 1 study did not report data, and these data were not obtained on request. Ten studies including 918 participants were included in the meta-analysis. The methods of measuring stool consistency varied, with most studies using the Bristol Stool Form Scale or a modified version of it. Fiber significantly improved stool consistency compared to control (SMD: 0.32; 95% CI: 0.18, 0.46; P < 0.0001), and no significant heterogeneity was detected (I2 = 0%; P = 0.56). Subgroup analyses showed that psyllium [SMD: 0.52 (95% CI: 0.25, 0.78; P = 0.0002); I2 = 0% (P = 0.46)] and inulin-type fructans [SMD: 0.36 (95% CI: 0.03, 0.70; P = 0.03); I2 = 0% (P = 0.38)] significantly improved stool consistency, but polydextrose and GOS did not; however, no significant subgroup differences were detected (P = 0.40 ) (Figure 4). Nonprebiotic interventions significantly improved stool consistency [SMD: 0.35 (95% CI: 0.16, 0.53; P = 0.0002); I2 = 0% (P = 0.46)], while prebiotics or mixtures did not; however, no significant subgroup differences were detected (P = 0.65). High fiber doses (>10 g/d) improved stool consistency (SMD: 0.42; 95% CI: 0.26, 0.59; P < 0.00001), but low fiber doses (≤10 g/d) did not, with a significant subgroup effect (P = 0.02). All durations (less than or greater than 4 weeks) were effective at improving stool consistency. There was no significant heterogeneity detected between studies within each subgroup (Supplemental Figure 4). Funnel plot asymmetry was detected (Supplemental Figure 24).
Stool weight: Stool weight was reported in 3 studies including 59 participants. Fiber did not affect stool weight compared to control (MD: 31.93 g/d; 95% CI: −3.74, 67.60 g/d; P = 0.08), and there was no significant heterogeneity (I2 = 46%; P = 0.15) (Supplemental Figure 5).
Gut transit time: Whole GTT was reported in 7 studies including 485 participants. All studies measured transit time using the radio-opaque marker method. Fiber had no significant effect on whole GTT (MD: −7.5 hours; 95% CI: −18.1, 3.1 hours; P = 0.17), and considerable heterogeneity was detected (I2 = 81%; P < 0.00001) (Supplemental Figure 6). The effect of higher doses of fiber (>10 g/d) in decreasing whole GTT approached conventional statistical significance [MD: −12.3 hours (95% CI: −25.1, 0.5 hours; P = 0.06); I2 = 83% (P < 0.00001)], but low fiber doses (≤10 g/d) did not impact whole GTT, with a significant subgroup effect (P = 0.05). Greater treatment durations (≥4 weeks) significantly decreased whole GTT by −18.4 hours [95% CI: −31.5, –5.4 hours; P = 0.006; I2 = 77% (P = 0.001)], but shorter durations (<4 weeks) did not, with a significant subgroup effect (P = 0.003) (Supplemental Figure 6).
Regional GTT was reported in 2 studies. Fiber had no significant impact on right, left, or rectosigmoid transit time compared to control (Supplemental Figure 7).
Integrative symptom scores: Various questionnaires were used to measure integrative symptom scores in 5 studies including 531 participants. Fiber had no significant effect on integrative symptom scores [SMD: −0.15 (95% CI: −0.39, 0.08; P = 0.20); I2 = 37% (P = 0.12)]. Fiber doses higher or lower than 10 g/d had no effect on symptom scores. Greater treatment durations (≥4 weeks) led to significant improvements in symptom scores [SMD: −0.42 (95% CI: −0.77, −0.06; P = 0.02); I2 = 32% (P = 0.22)] but shorter durations (<4 weeks) did not, with a significant subgroup effect (P = 0.04). However, low numbers of studies contributed data in each subgroup (Supplemental Figure 8).
A sensitivity analysis was conducted for studies that measured and reported integrative symptom scores using the PAC-SYM questionnaire, and a MD was calculated. In 3 studies including 428 participants, fiber had no impact on PAC-SYM global scores [MD: −0.10 scale points (95% CI: −0.31, 0.11 scale points; P = 0.35); I2 = 48% (P = 0.07); a lower score denotes less severe symptoms]. In addition, fiber had no impact on the abdominal, rectal, or stool subscales of PAC-SYM (Supplemental Figures 9–12). All 3 studies measured 1 other integrative symptom score—2 measured the CCCS and 1 measured the Bowel Function Index —and reported no difference between intervention and control groups.
Individual gastrointestinal symptoms: The effect of fiber supplementation on the severity of individual symptoms was widely reported in various studies (Supplemental Figures 13–17).
Severity of straining was reported in 4 studies including 489 participants. Fiber significantly improved straining severity compared to control [SMD: −0.32 (95% CI: −0.59, −0.04; P = 0.02); I2 = 46% (P = 0.10)]. Subgroup analyses showed that only psyllium significantly improved straining severity [SMD: −0.65 (95% CI: −0.91, −0.39; P < 0.00001); I2 = 0% (P = 0.67)], while polydextrose and inulin-type fructans did not (Figure 5). High fiber doses (>10 g/d) improved straining severity [SMD: −0.45 (95% CI: −0.73, −0.16; P = 0.002); I2 = 34% (P = 0.002)], but low fiber doses (≤10 g/d) did not, with a significant subgroup effect (P = 0.09). However, a low number of studies contributed data in each subgroup (Supplemental Figure 13).
Severity of flatulence was reported in 3 studies including 153 participants. Fiber significantly worsened flatulence severity compared to control (SMD: 0.80; 95% CI: 0.47, 1.13; P < 0.00001), and there was no significant heterogeneity (I2 = 0%; P = 0.84). Subgroup analysis indicated that 2 studies administering inulin-type fructans significantly worsened flatulence severity [SMD: 0.79 (95% CI: 0.44, 1.14; P < 0.00001); I2 = 0% (P = 0.60) (Figure 5; Supplemental Figure 14)]. Fiber had no significant impact on severity of incomplete evacuation, bloating, or abdominal pain or discomfort (Supplemental Figures 15–17).
The frequency of individual symptoms was less commonly reported amongst studies, and suitable data could not be obtained for more than 1 study; therefore, a meta-analysis was not performed.
Several other individual symptoms were reported in the same way by only 1 study each and, therefore, meta-analyses were not possible. These outcomes were occurrence of hard stools, pain with defecation, sensation of anal obstruction, use of manual maneuvers, defecation difficulties, ease of passage, time spent on the toilet, and borborygmi. Of note, in 1 study administering an unspecified type of fiber, the frequency of sensation of anal obstruction was significantly lower in the fiber group compared to the control group (P = 0.032). In a study administering pectin, the time spent on the toilet was significantly lower in the fiber group compared to the control group(P < 0.05).
Quality of life: Two studies including 296 participants reported overall quality of life (QoL) measurements using the Patient Assessment of Constipation Quality of Life (PAC-QoL) global score. Both studies administered polydextrose and found that it did not impact QoL scores (MD: −0.04 scale points; 95% CI: −0.19, 0.10 scale points; P = 0.54; a higher score indicates more severe), and heterogeneity was not significant (I2 = 37%; P = 0.17). Fiber doses higher or lower than 10 g/d had no impact on PAC-QoL. Greater treatment durations (≥4 weeks) significantly improved global scores [MD: −0.25 scale points (95% CI: −0.48, −0.03 scale points; P = 0.03); I2 = 0% (P = 0.66)], while shorter durations (<4 weeks) did not, with a significant subgroup effect (P = 0.03). However, these data derive from 2 intervention groups of the same study (Supplemental Figure 18). Fiber had no impact on QoL subscales for satisfaction, physical discomfort, worries and concerns, or psychosocial discomfort (Supplemental Figures 19–22).
Laxative use: Two studies measured laxative use; however, data were only reported for 1 study. In this study, pectin supplementation significantly reduced the number of days participants took laxatives compared to control [mean: 1.4 days (SD: 1.0 days) compared with 1.9 days (SD: 1.2 days), respectively; P < 0.01].
Adverse events: Adverse events were reported in 12 studies including 1089 participants. In 1 study administering polydextrose, 18 events were considered to be related to the intervention and 10 events were considered to be related to the control treatment. These were all mild to moderate, except for 1 event in the polydextrose group that was severe (nausea). Another study administering polydextrose reported events such as abdominal pain, but there was no link identified between treatment groups and the occurrence of adverse events. One study administering psyllium reported that 2 participants (18%) in the intervention group had abdominal pain, compared to none in the control group. Another study administering psyllium reported that 3 participants withdrew from the intervention group and 5 from the control group, for reasons related to the reported treatment side effects. A study administering wheat bran reported participant withdrawal due to “unbearable” abdominal pain. Two studies reported that while adverse events did occur, none interfered with the trial process. Finally, 2 studies administering psyllium, 1 administering pectin, and 2 administering GOS reported no serious adverse events associated with the fiber products.
Compliance: Compliance was measured in 7 studies, but reported in only 3. Of those that counted returned sachets, 1 study reported >98% compliance and another reported >95% compliance in each group. One study reported that compliance was equally satisfactory in both groups; however, no data were provided. Another 2 of the 7 studies reported the numbers of participants excluded for noncompliance only: in the first RCT, 3 participants were excluded in the fiber group and none were excluded in the control group; and in the other, 4 participants were excluded, but the group they belonged to was not dislosed.
Risk of bias at the outcome and study levels: No study was at low RoB across all domains. Bias due to the randomization process was judged to have low risk in 3 studies and some concerns in 13 studies due to inadequate details on the methods used in the generation of the randomization sequence or for concealment of allocation. Bias due to deviations from the intended interventions was judged to have low risk in 6 studies, some concerns in 2 studies, and high risk in 8 studies; as although all but 2 studies were double-blinded, many did not follow an intention-to-treat analysis. Bias across other domains varied at the outcome level (Supplemental Figures 1–22A).
원문 발췌 · van der Schoot A, Drysdale C, Whelan K, Dimidi E, Am J Clin Nutr 2022 · CC BY 4.0 라이선스에 따라 수정 없이 인용했습니다(본문 속 인용 번호는 생략).
[6]Liu Z, Yan S, Wu J, He L, Li N, Dong G, et al. Acupuncture for Chronic Severe Functional Constipation: A Randomized Trial. Ann Intern Med. 2016;165(11):761-769. doi:10.7326/m15-3118. PMID: 27618593.
요약 심한 만성 기능성 변비 환자 1,075명을 전침과 가짜 전침으로 나눈 무작위 대조 연구입니다. 8주 동안 주당 자발적 완전 배변 횟수는 전침 군이 1.76회, 가짜 전침 군이 0.87회 늘었습니다.원문은 출판사 저작권 자료로, 위 링크에서 확인하실 수 있습니다.
[7]Zhong LLD, Cheng CW, Kun W, Dai L, Hu DD, Ning ZW, et al. Efficacy of MaZiRenWan, a Chinese Herbal Medicine, in Patients With Functional Constipation in a Randomized Controlled Trial. Clin Gastroenterol Hepatol. 2019;17(7):1303-1310.e18. doi:10.1016/j.cgh.2018.04.005. PMID: 29654915.
요약 기능성 변비 환자 291명을 마자인환, 센나, 위약으로 나눈 무작위 대조 연구입니다. 8주째 완전 반응률은 마자인환 68%, 센나 57.7%(유의한 차이 없음), 위약 33.0%였습니다.원문은 출판사 저작권 자료로, 위 링크에서 확인하실 수 있습니다.